diagnostic menu ASTON MARTIN DB7 1997 User Guide
[x] Cancel search | Manufacturer: ASTON MARTIN, Model Year: 1997, Model line: DB7, Model: ASTON MARTIN DB7 1997Pages: 421, PDF Size: 9.31 MB
Page 389 of 421
The Aston Martin Lagonda Diagnostic System
Users Guide ^?
Engine Setup
- 95 MY
Two adjustments
may
beset with the aid of the PDU
on 95
MY vehicles.
• Throttle Potentiometer
• Idle Fuelling Trim
From
the 95 MY
Main Menu, make
and
confirm
the
following sequence
of
selections:
Diagnostics
/
Manual
or
Auto Transmission
/
Engine
/
Engine Setup
/
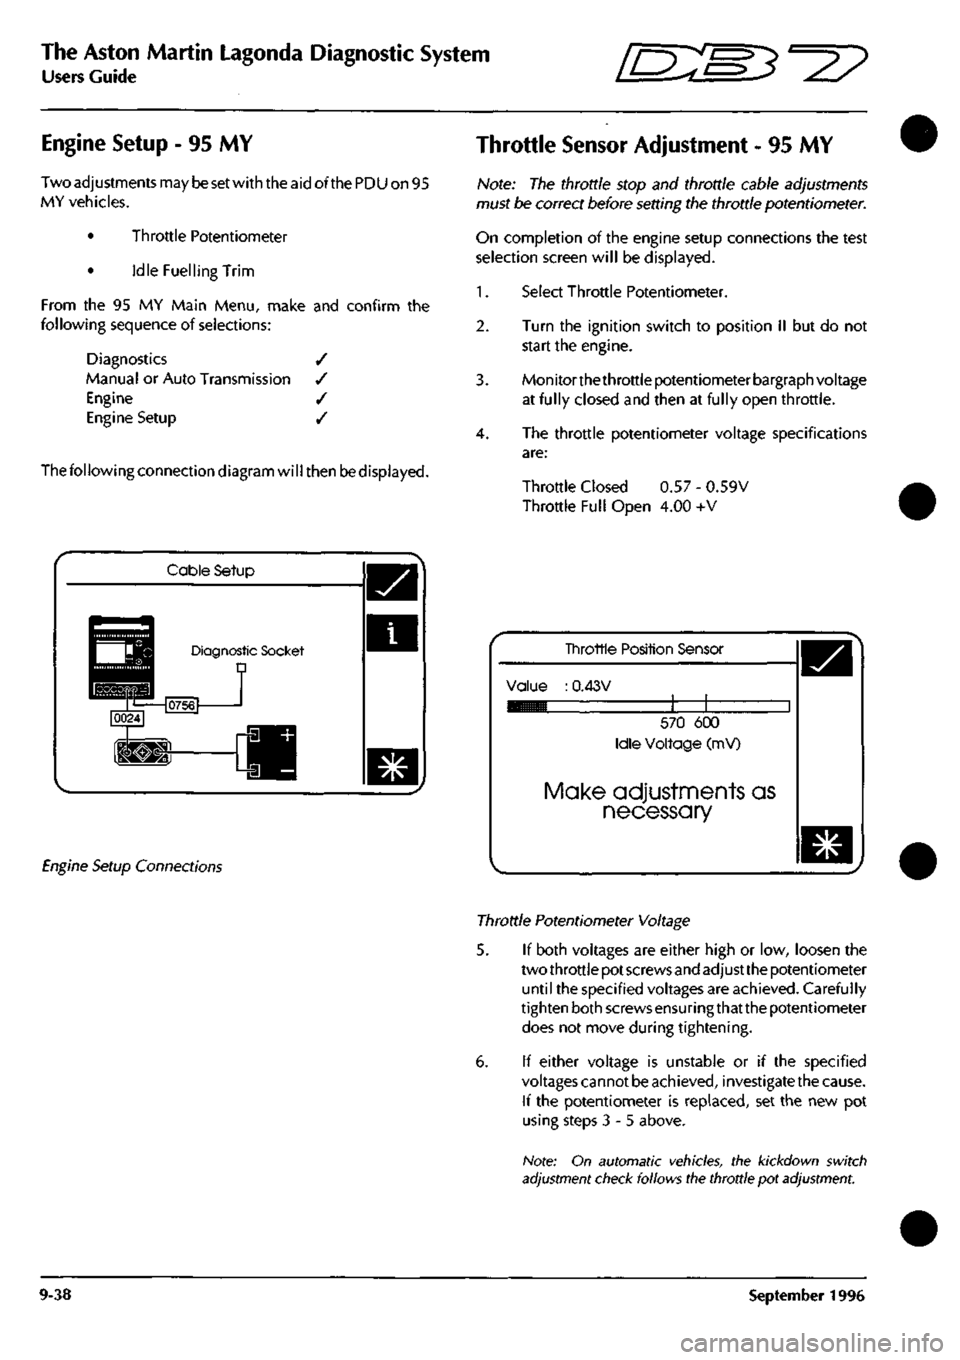
The following connection diagram will then be displayed.
Throttle Sensor Adjustment
- 95 MY
Note:
The
throttle stop
and
throttle cable adjustments
must
be
correct before setting
the
throttle potentiometer.
On completion
of the
engine setup connections
the
test
selection screen will
be
displayed.
1.
Select Throttle Potentiometer.
2.
Turn
the
ignition switch
to
position
II but do not
start
the
engine.
3. Monitorthethrottle potentiometer bargraph voltage
at fully closed
and
then
at
fully open throttle.
4.
The
throttle potentiometer voltage specifications
are:
Throttle Closed
0.57 -
0.59V
Throttle Full Open
4.00 +V
Cable Setup
Diagnostic Socket D
Engine Setup Connections
Tinrottle Position Sensor
Value
:
0.43V
570
600
Idle Voltage
(mV)
Make adjustments as
necessary
Throttle Potentiometer Voltage
5.
If
both voltages
are
either high
or low,
loosen
the
two throttle pot screws and adjust the potentiometer
until
the
specified voltages
are
achieved. Carefully
tighten both screws ensuringthat the potentiometer
does
not
move during tightening.
6.
If
either voltage
is
unstable
or if the
specified
voltages cannot
be
achieved, investigate the cause.
If
the
potentiometer
is
replaced,
set the new pot
using steps
3-5
above.
Note:
On
automatic vehicles,
the
kickdown switch
adjustment check follows the throttle
pot
adjustment.
9-38 September
1996
Page 390 of 421
ffi:
The Aston Martin Lagonda Diagnostic System
Users Guide
Idle Fuelling Trim - 95 MY
This program is used to check and if necessary reset the
fuelling level at idle to ensure that the specified idle speed
and emission levels are attainable. The throttle
potentiometer adjustment sequence must be completed
before the fuel trim sequence can be run.
Note: The throttle setup must be completed before
attempting to set the Idle Fuelling Trim. An error in
throttle
stop,
throttle cable or throttle pot
adjustments can
cause serious
difficulties in setting the Idle Fuelling.
Select Idle Fuelling Trim from the Engine Setup
Menu.
(The PDU connections are
as
fortheThrottle
Potentiometer Adjustment.)
1.
3.
StarttheDB7engineand allow itto warm to normal
operating temperature.
Followthescreeninstructionstorunthe idle fuelling
trim procedure.
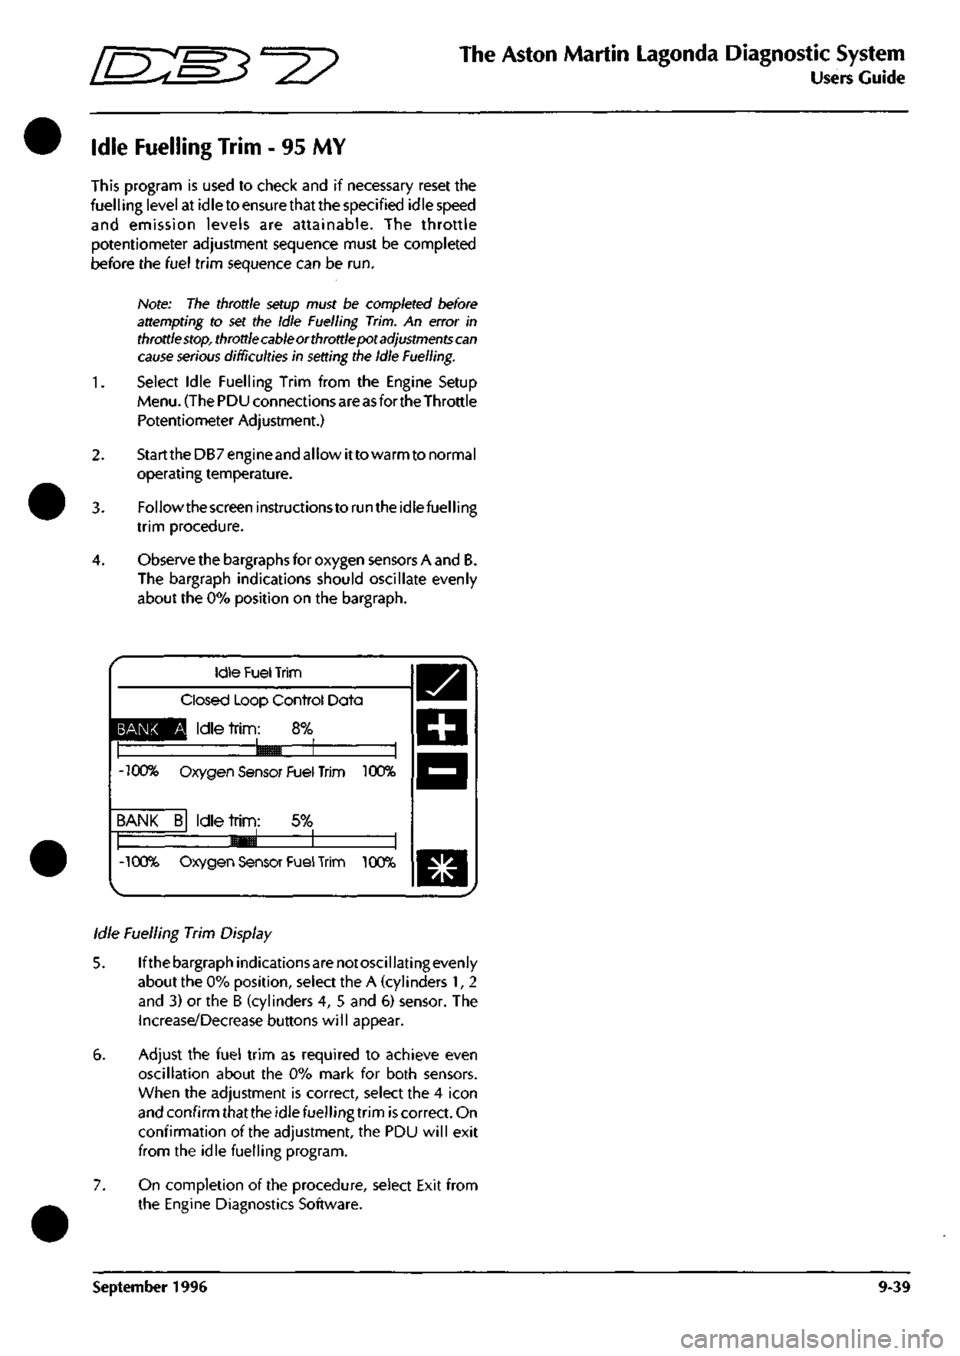
Observe the bargraphs for oxygen sensors A and B.
The bargraph indications should oscillate evenly
about the 0% position on the bargraph.
BANK
-100%
BANK
-100%
Idle
Fuel
Trim
Closed Loop Control Data
Q Idle
trim:
8%
9^B 1 1
Oxygen Sensor Fuel Trim 100%
B Idle
trim:
5% —1 1 1
«^
1 1 Oxygen Sensor Fuel
Trim
100%
Idle Fuelling Trim Display
5. Ifthebargraphindicationsarenotoscillatingevenly
about the 0% position, select the A (cylinders 1, 2
and 3) or the B (cylinders 4, 5 and 5) sensor. The
Increase/Decrease buttons will appear.
6. Adjust the fuel trim as required to achieve even
oscillation about the 0% mark for both sensors.
When the adjustment is correct, select the 4 icon
and confirm that the idle fuelling trim is correct. On
confirmation of the adjustment, the PDU will exit
from the idle fuelling program.
7. On completion of the procedure, select Exit from
the Engine Diagnostics Software.
September 1996 9-39
Page 392 of 421
^^?
The Aston Martin Lagonda Diagnostic System
Users Guide
Transmission Diagnostics
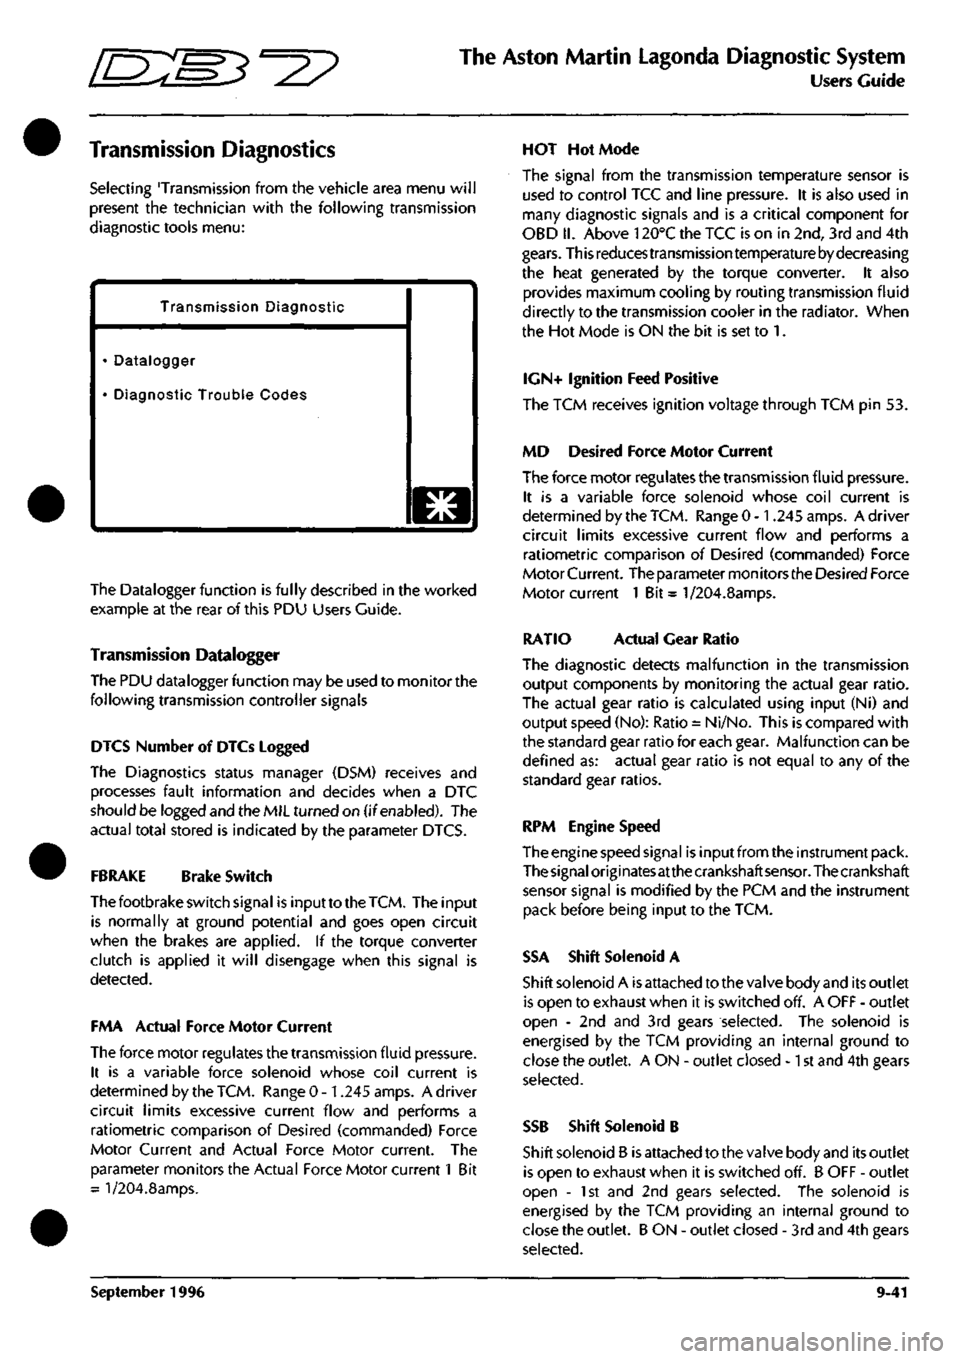
Selecting 'Transmission from the vehicle area menu will
present the technician with the following transmission
diagnostic tools menu:
Transmission Diagnostic
• Datalogger
• Diagnostic Trouble Codes
o
The Datalogger function is fully described in the worked
example at the rear of this PDU Users Guide.
Transmission Datalogger
The PDU datalogger function may be used to monitor the
following transmission controller signals
DIGS Number of DTCs Logged
The Diagnostics status manager (DSM) receives and
processes fault information and decides when a DTC
should be logged and the MIL turned on (if enabled). The
actual total stored is indicated by the parameter DTCS.
FBRAKE Brake Switch
The footbrake switch signal is input to the
TCM.
The input
is normally at ground potential and goes open circuit
when the brakes are applied. If the torque converter
clutch is applied it will disengage when this signal is
detected.
FMA Actual Force Motor Current
The force motor regulates the transmission fluid pressure.
It is a variable force solenoid whose coil current is
determined by the TCM. Range 0 -1.245 amps. A driver
circuit limits excessive current flow and performs a
ratiometric comparison of Desired (commanded) Force
Motor Current and Actual Force Motor current. The
parameter monitors the Actual Force Motor current 1 Bit
= l/204.8amps.
HOT Hot Mode
The signal from the transmission temperature sensor is
used to control TCC and line pressure. It is also used in
many diagnostic signals and is a critical component for
OBD II. Above 120°C the TCC is on in 2nd, 3rd and 4th
gears.
This reduces transmission temperature by decreasing
the heat generated by the torque converter. It also
provides maximum cooling by routing transmission fluid
directly to the transmission cooler in the radiator. When
the Hot Mode is ON the bit is set to 1.
IGN+ Ignition Feed Positive
The TCM receives ignition voltage through TCM pin 53.
MD Desired Force Motor Current
The force motor regulates the transmission fluid pressure.
It is a variable force solenoid whose coil current is
determined by the TCM. Range 0 -1.245 amps. A driver
circuit limits excessive current flow and performs a
ratiometric comparison of Desired (commanded) Force
Motor Current. The parameter mon itors the Desired Force
Motor current 1 Bit = 1/204.8amps.
RATIO Actual Gear Ratio
The diagnostic detects malfunction in the transmission
output components by monitoring the actual gear ratio.
The actual gear ratio is calculated using input (Ni) and
output speed (No): Ratio = Ni/No. This is compared with
the standard gear ratio for each gear. Malfunction can be
defined as: actual gear ratio is not equal to any of the
standard gear ratios.
RPM Engine Speed
The engine speed signal is input from the instrument pack.
The
signal
origi
nates
at the crankshaft
sensor.
The crankshaft
sensor signal is modified by the PCM and the instrument
pack before being input to the TCM.
SSA Shift Solenoid A
Shift solenoid A is attached to the valve body and its outlet
is open to exhaust when it is switched off. A OFF - outlet
open - 2nd and 3rd gears selected. The solenoid is
energised by the TCM providing an internal ground to
close the outlet. A ON - outlet closed -1 st and 4th gears
selected.
SSB Shift Solenoid B
Shift solenoid B is attached to the valve body and its outlet
is open to exhaust when it is switched off. B OFF - outlet
open - 1st and 2nd gears selected. The solenoid is
energised by the TCM providing an internal ground to
close the outlet. B ON - outlet closed - 3rd and 4th gears
selected.
September 1996 9-41
Page 394 of 421
^?
The Aston Martin Lagonda Diagnostic System
Users Guide
Climate Control Diagnostics
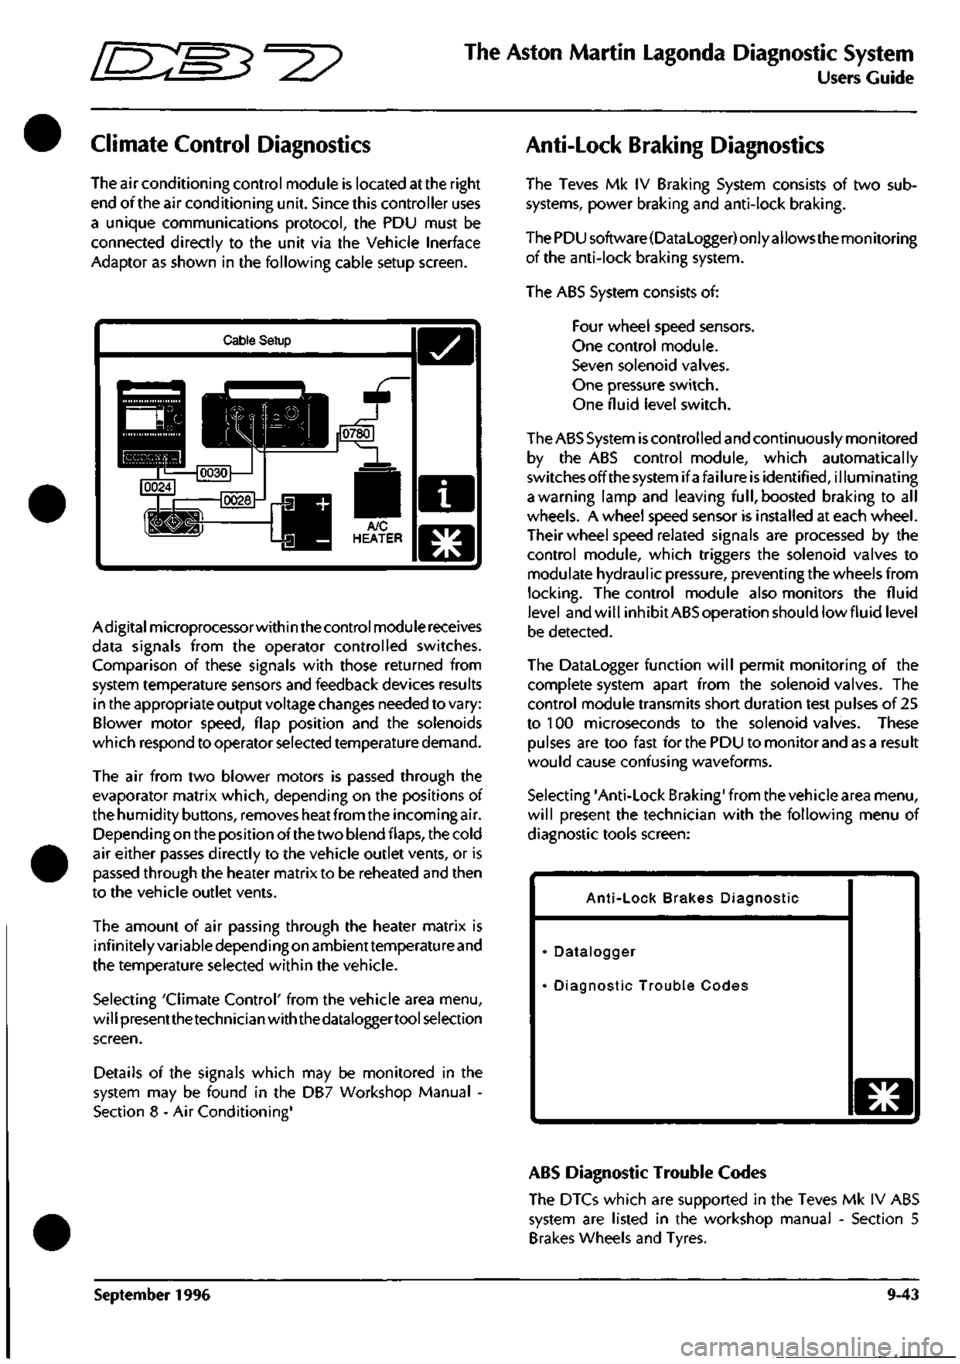
The air conditioning control module is located at the right
end of the air conditioning unit. Since this controller uses
a unique communications protocol, the PDU must be
connected directly to the unit via the Vehicle Inerface
Adaptor as shown in the following cable setup screen.
Cable Setup
Adigitalmicroprocessorwithin the control module receives
data signals from the operator controlled switches.
Comparison of these signals with those returned from
system temperature sensors and feedback devices results
in the appropriate output voltage changes needed to vary:
Blower motor speed, flap position and the solenoids
which respond to operator selected temperature demand.
The air from two blower motors is passed through the
evaporator matrix which, depending on the positions of
the humidity buttons, removes heat from the incoming air.
Dependingon the position of the two blend flaps, the cold
air either passes directly to the vehicle outlet vents, or is
passed through the heater matrix to be reheated and then
to the vehicle outlet vents.
The amount of air passing through the heater matrix is
infinitely variable depending on ambienttemperature and
the temperature selected within the vehicle.
Selecting 'Climate Control' from the vehicle area menu,
will presentthetechnician with the dataloggertool selection
screen.
Details of the signals which may be monitored in the
system may be found in the DB7 Workshop Manual -
Section 8 - Air Conditioning'
Anti-Lock Braking Diagnostics
The Teves Mk IV Braking System consists of two sub
systems, power braking and anti-lock braking.
The PDU software(DataLogger) only allows the monitoring
of the anti-lock braking system.
The ABS System consists of:
Four wheel speed sensors.
One control module.
Seven solenoid valves.
One pressure switch.
One fluid level switch.
The ABS System
is
controlled and continuously monitored
by the ABS control module, which automatically
switchesoffthesystemifafailure is identified, illuminating
a warning lamp and leaving
full,
boosted braking to all
wheels. A wheel speed sensor is installed at each wheel.
Their wheel speed related signals are processed by the
control module, which triggers the solenoid valves to
modulate hydraulic pressure, preventing the wheels from
locking.
The control module also monitors the fluid
level and will inhibit ABS operation should lowfluid level
be detected.
The Datalogger function will permit monitoring of the
complete system apart from the solenoid valves. The
control module transmits short duration test pulses of 25
to 100 microseconds to the solenoid valves. These
pulses are too fast for the PDU to monitor and as a result
would cause confusing waveforms.
Selecting 'Anti-Lock Braking' from the vehicle area menu,
will present the technician with the following menu of
diagnostic tools screen:
Anti-Lock Brakes Diagnostic
Datalogger
Diagnostic Trouble Codes
o
ABS Diagnostic Trouble Codes
The DTCs which are supported in the Teves Mk IV ABS
system are listed in the workshop manual - Section 5
Brakes Wheels and Tyres.
September 1996 9-43
Page 401 of 421
The Aston Martin Lagonda Diagnostic System
Users Guide ^=2?
Printer Use Digital Multimeter
Print Trace
The Trace Buffer is used to record technician use of the
PDU.As the diagnostics are executed, the following
information is written to trace:
Screen Title
Menu options selected
Operator questions selected
Operator actions
Control module information
Test limits and results
P codes detected by the DTC monitor
Snapshot data from the datalogger
OBD II freeze frame data
Set up the printer and load with paper. Select Print
Trace and confirm the selection. All recorded
information in the above list will be printed.
Printtrace is supported in English, French, German and
Italian.
Print Screen
The Print Screen function dumps a bitmap image of the
current screen display to the printer. This function is
particularly useful for recordingdata such as waveforms
captured by the datalogger application.
The print screen function is supported in English,
French,
German, Italian and Japanese.
Introduction
The Digital Multi-Meterprovidesthecapability to measure
voltage, current, resistance, frequency, pulse width, pulse
period and duty cycle using measurement probes or
vehicle interface adaptor channels.
WARNING: DMM measurements must not be taken
while the PDU
is
connected to the
base
station. The PDU
measurement system
becomes
referenced to earth when
connected to the base station. Serious measurement
errors may be present
because
of any voltage difference
between vehicle ground and base station earth. Operation
of the PDU in this mode has both functional and safety
implications and therefore must be
avoided.
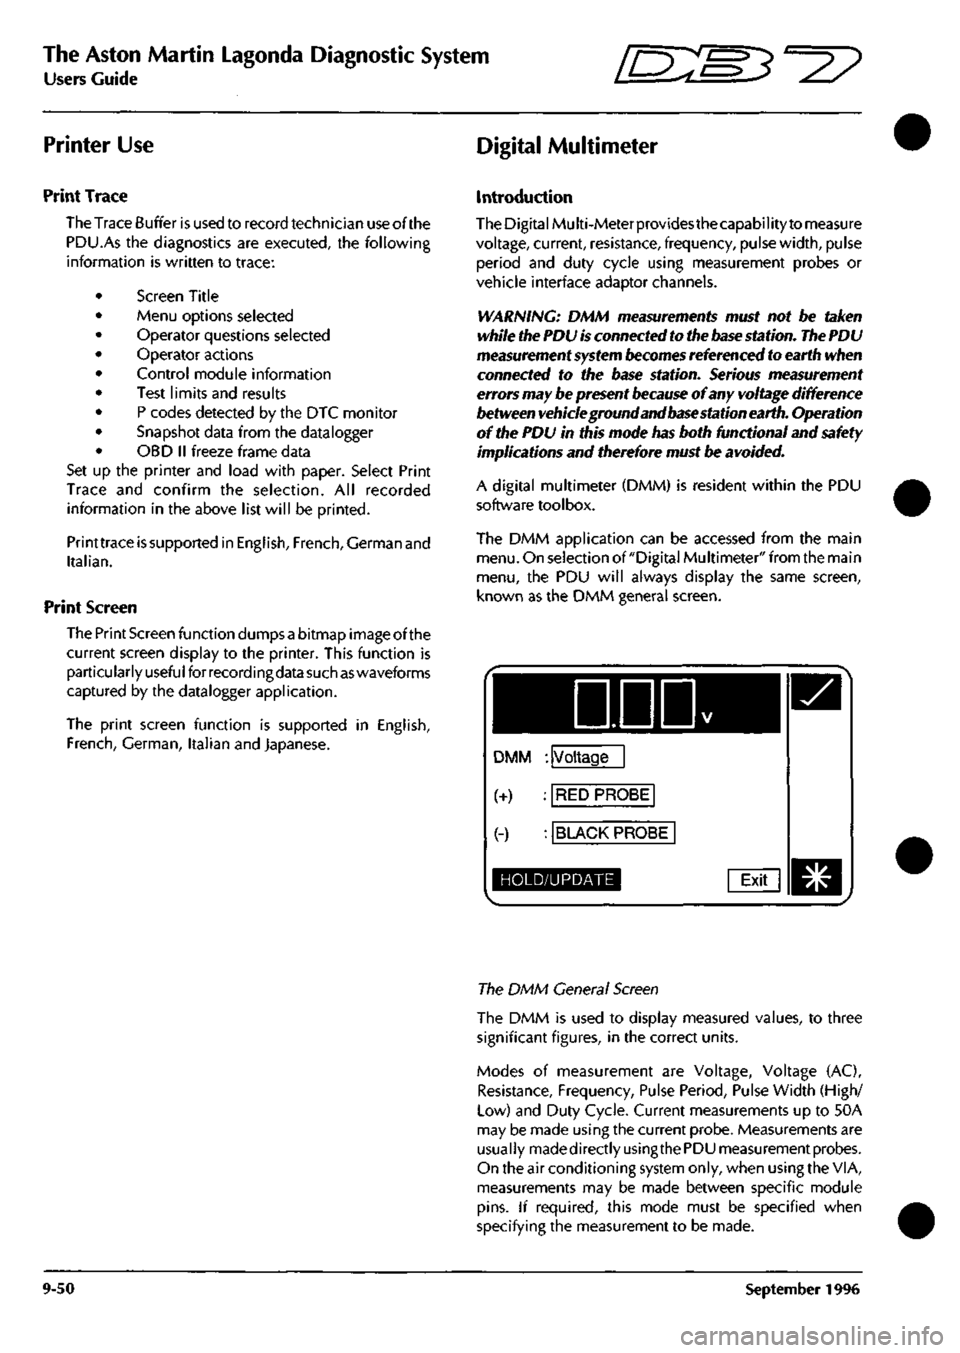
A digital multimeter (DMM) is resident within the PDU
software toolbox.
The DMM application can be accessed from the main
menu.
On selection of "Digital Multimeter" from the main
menu,
the PDU will always display the same screen,
known as the DMM general screen.
DDD
DMM : Voltage
(+) : RED PROBE
(-) : BLACK PROBE
HOLD/UPDATE Exit
The DMM General Screen
The DMM is used to display measured values, to three
significant figures, in the correct units.
Modes of measurement are Voltage, Voltage (AC),
Resistance, Frequency, Pulse Period, Pulse Width (High/
Low) and Duty Cycle. Current measurements up to 50A
may be made using the current probe. Measurements are
usually madedirectlyusingthe PDU measurement probes.
On the air conditioning system only, when using the VIA,
measurements may be made between specific module
pins.
If required, this mode must be specified when
specifying the measurement to be made.
9-50 September 1996
Page 404 of 421
^7
The Aston Martin Lagonda Diagnostic System
Users Guide
Diagnostic Trouble Codes
Introduction
The 'Diagnostic trouble codes' application enables the
PDU to monitor the trouble codes logged in selected
control module's and provides the following functions:
• Decode and display any trouble codes logged by
the control module(s) being monitored.
• Decode and display enhanced diagnostic
information, together with any count of the number
of occurrences, when supported by the control
module(s).
• Clearsomeorallofallthesetroublecodes selected
by the user on the PDU screen, when supported by
the control module(s).
Diagnostic Trouble Codes are logged by the Engine
Management and by the Automatic Transmission control
units and can be accessed using the PDU. Logged codes
in the 95 MY Teves Mk II ABS controller can only be
accessed using the brake warning light. The Air
Conditioning control unit does not log trouble codes.
Operation
From the Main Menu make the following selections:
Select Diagnostics
Select Engine or Transmission
The system will then load the appropriate
software
Select Diagnostic Trouble Codes
Connect the PDU to the car as shown on the
screen diagram
Select the / icon to confirm connection
The PDU will then interrogate the chosen control
unit and will display any logged trouble codes.
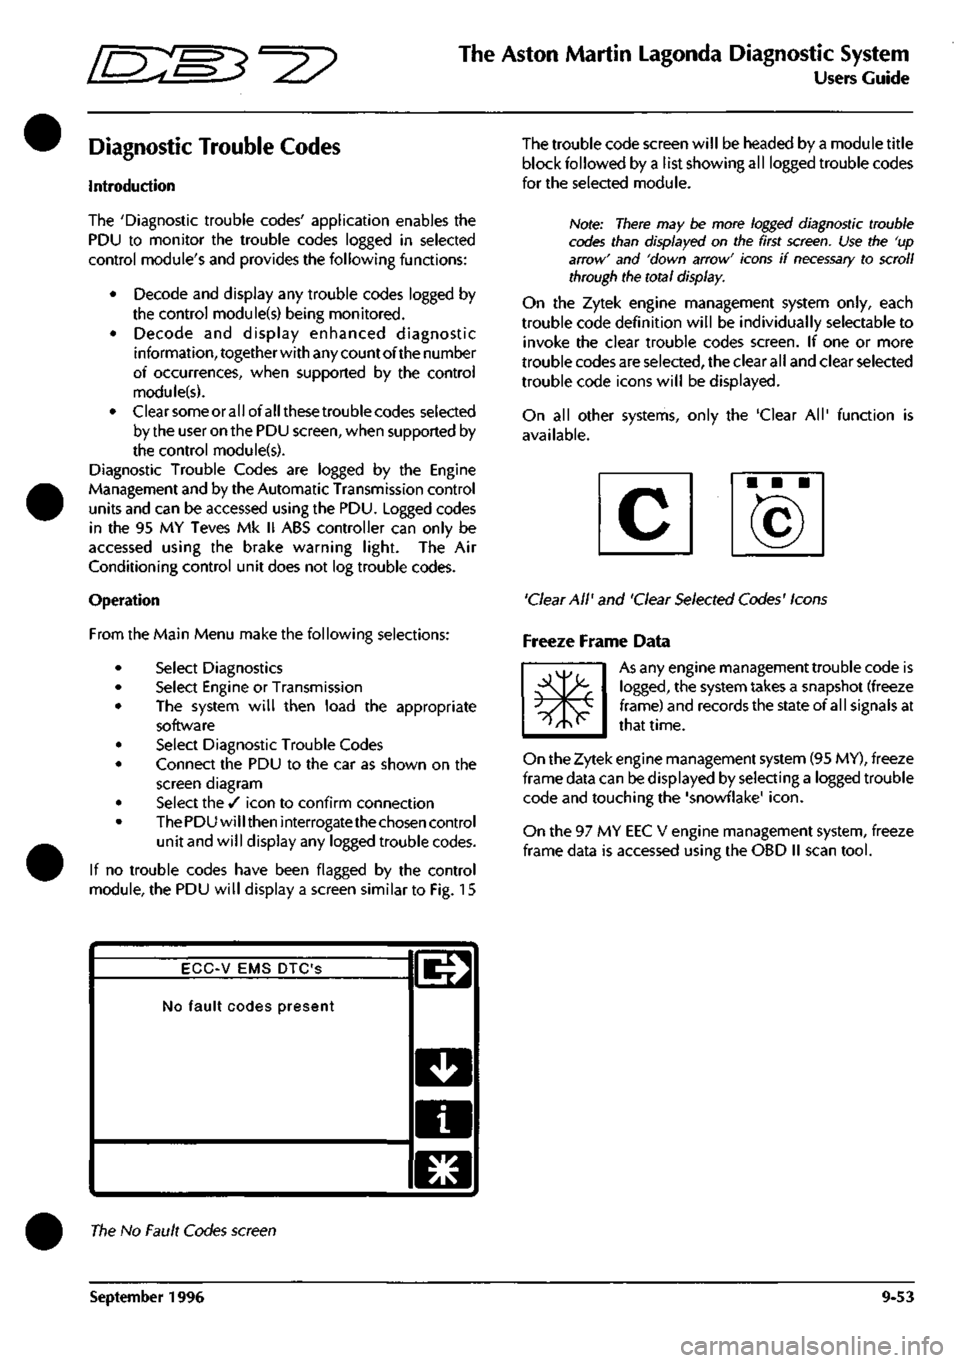
If no trouble codes have been flagged by the control
module, the PDU will display a screen similar to Fig. 15
The trouble code screen will be headed by a module title
block followed by a list showing all logged trouble codes
for the seleaed module.
Note: There may be more logged diagnostic trouble
codes than displayed on the first
screen.
Use the 'up
arrow' and 'down arrow' icons if
necessary
to scroll
through the total display.
On the Zytek engine management system only, each
trouble code definition will be individually selectable to
invoke the clear trouble codes screen. If one or more
trouble codes are selected, the clear all and clear selected
trouble code icons will be displayed.
On all other systems, only the 'Clear All' function is
available.
'Clear All' and 'Clear Selected Codes' Icons
Freeze Frame Data
m*
As any engine management trouble code is
logged,
the system takes a snapshot (freeze
frame) and records the state of all signals at
that time.
On the Zytek engine management system (95 MY), freeze
frame data can be displayed by selecting a logged trouble
code and touching the 'snowflake'
icon.
On the 97 MY EEC V engine management system, freeze
frame data is accessed using the OBD II scan
tool.
ECC-V EMS DTC'S
No fault codes present
l^
D
a
El
The No Fault Codes screen
September 1996 9-53
Page 406 of 421
"^I?
The Aston Martin Lagonda Diagnostic System
Users Guide
Datalogger
Introduction
Datalogger is software produced to identify permanent or
intermittent faults on vehicle electronics. The objective of
Datalogger is to provide a view of the vehicle's electrical
behaviour, such that intermittent activity can be recorded
and interpreted quickly and accurately. Running on the
Portable Diagnostic Unit (PDU), the Datalogger
appi ication can captu
re
vehicle information in three ways.
• Serial communications direct from the control unit.
• Parallel communications using the Interface Adaptor.
• Direct signal monitoringusingthemeasurementprobes.
Serial Communication
Serial Communication is a two-wire communication link
between the PDU and most vehicle control modules
providingdigital measurements forconnected components.
The serial communication link allows the tester to
determine the current condition of components connected
to the control module, and to identify any history of faults.
On later vehicles, the PDU is connected to the vehicle
diagnostic sockets via the mu
Iti
Protocol Adaptor (MPA) to
gather serial data from the control modules.
Parallel Communication
The Vehicle Interface Adapter (VIA) provides an interface
between the PDU and the vehicle harnesses for the
acquisition of multiple analogue measurements. The VIA
is
connected between the relevantvehicle control module
and it'sharness connector. Thisallows the PDU to captu re
information from a multitude of channels entering the
control module. This vehicle interface is used with control
modules not equipped with a serial communication link
(Teves Mk II braking system and the air conditioning
system).
Measurement Probes
The measurement probes permit readings to be taken
directly from any connector on the vehicle.
Datalogger Applications
Datalogger may be used to interrogate the following DB7
systems:
• ABS braking system controller
• Engine Management Controller
• Air Conditioning Controller
• Automatic Transmission Controller
• Passive Anti Theft (97 MY)
• Security System (97 MY)
Using the Datalogger
Configure the vehicle to the normal operating conditions
for the system under test.
From the PDU main menu screen:
Highlight 'Diagnostics'.
Press the 'tick' icon to confirm the selection.
Enter the Transmission Type and confirm the selection.
Select the Vehicle Area to be tested and confirm the
selection.
The PDU tools screen should now be displayed.
Highlight 'Datalogger'.
Confirm the selection with the 'tick'
icon.
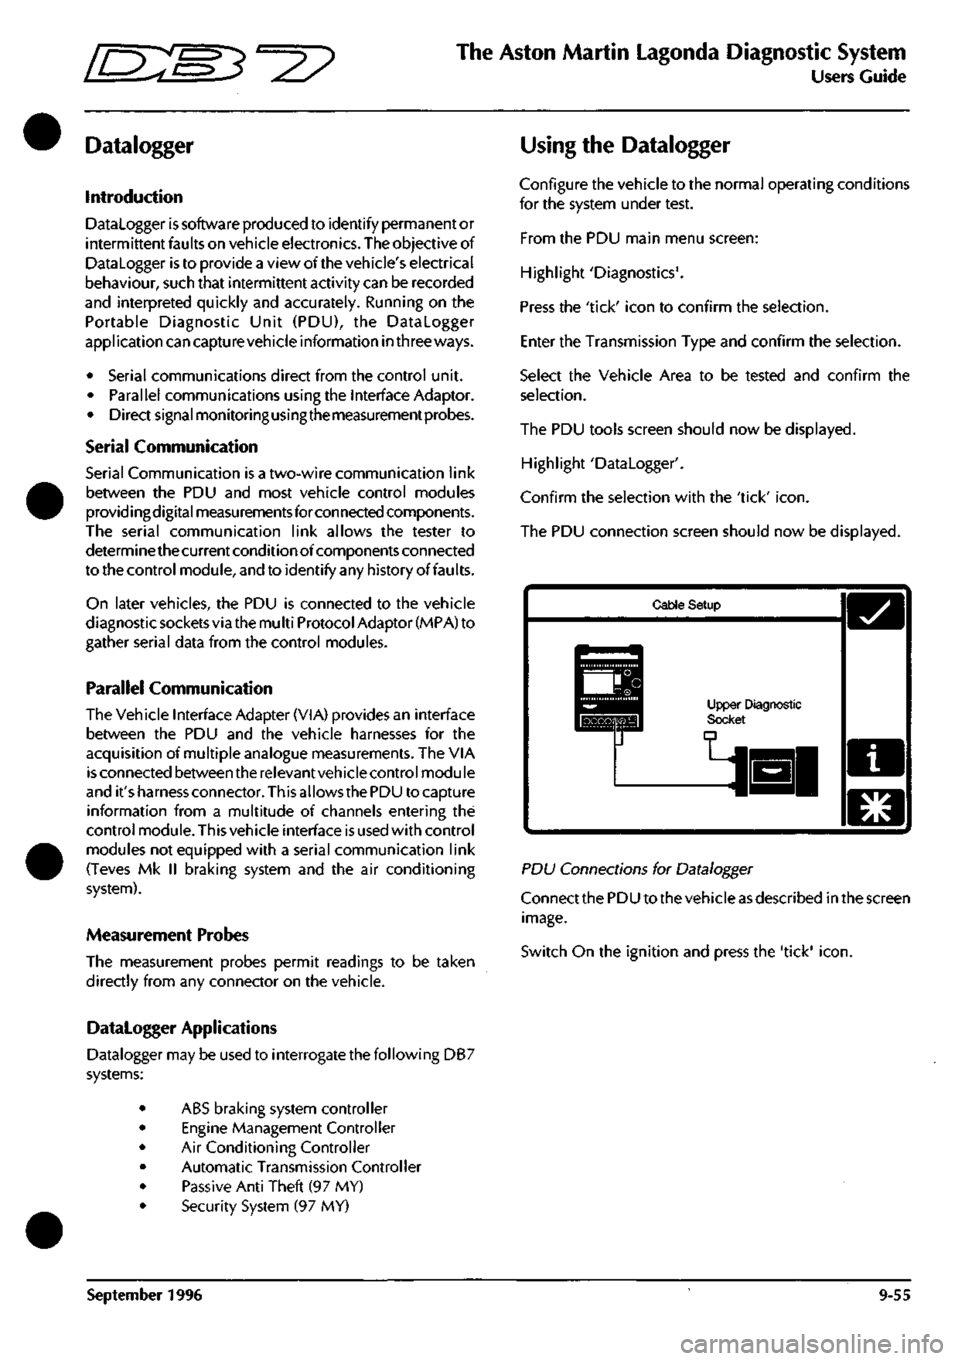
The PDU connection screen should now be displayed.
Cable Setup
Upper Diagnostic Socl
PD\J Connections for Datalogger
Connect the PDU to the vehicle as described in the screen
image.
Switch On the ignition and press the 'tick'
icon.
September 1996 9-55
Page 407 of 421
The Aston Martin Lagonda Diagnostic System
Users Guide •^^
'Establishing connection to control module' should now
be displayed on the screen.
If for any reason the PDU cannot communicate with the
relevantvehiclecontrol modulea 'communicationsfailure
screen'
will be displayed with a retry option.
Check all connections before retrying.
Once commu nications are successfu
I
'Starti ng Datalogger'
will appear on the screen momentarily.
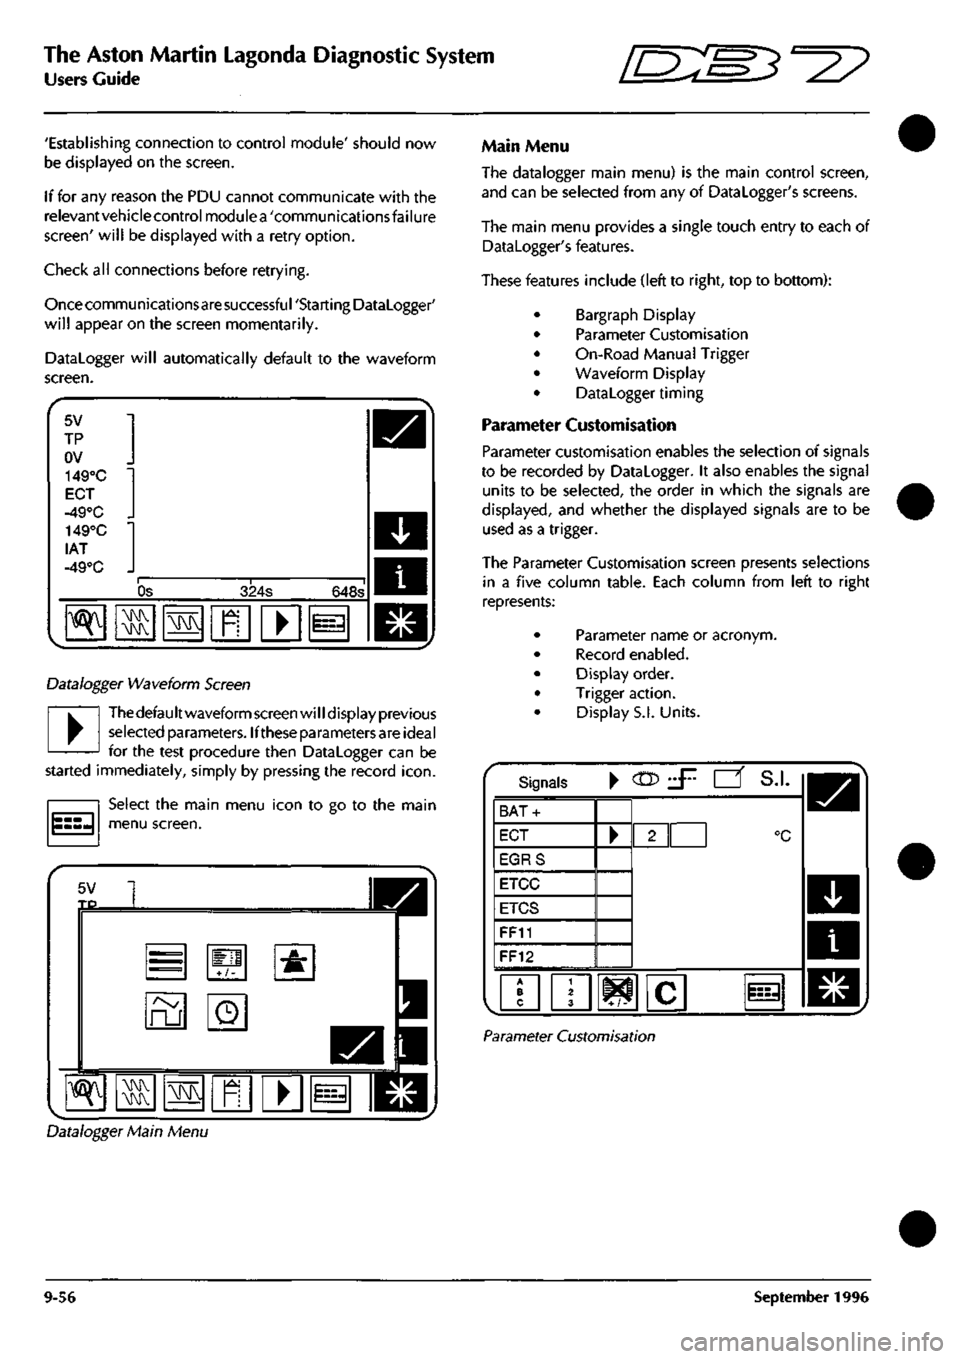
Datalogger will automatically default to the waveform
screen.
5V
TP
ov
149°C
EOT
-49°C _
lAT
-49°C _
"^
Os 324s 648s
•\N
M\^
\!M
n
• i=-i
Datalogger Waveform Screen
•
Thedefaultwaveform screen will display previous
selected parameters. Ifthese parameters are ideal
for the test procedure then Datalogger can be
started immediately, simply by pressing the record
icon.
Select the main menu icon to go to the main
menu screen.
5V TP
=
ru
+/-
o
•&
^ M\K ras
1
I
Main Menu
The datalogger main menu) is the main control screen,
and can be selected from any of Datalogger's screens.
The main menu provides a single touch entry to each of
Datalogger's features.
These features include (left to right, top to bottom):
Bargraph Display
Parameter Customisation
On-Road Manual Trigger
Waveform Display
Datalogger timing
Parameter Customisation
Parameter customisation enables the selection of signals
to be recorded by Datalogger. It also enables the signal
units to be selected, the order in which the signals are
displayed,
and whether the displayed signals are to be
used as a trigger.
The Parameter Customisation screen presents selections
in a five column table. Each column from left to right
represents:
Parameter name or acronym.
Record enabled.
Display order.
Trigger action.
Display S.I. Units.
Signals •
CO?
J^ •' S.I.
BAT-
ECT
EGRS
ETCC
ETCS
FF11
FF12
/•? 103
Parameter Customisation
Datalogger Main Menu
9-56 September 1996
Page 408 of 421
^
The Aston Martin Lagonda Diagnostic System
Users Guide
Parameter Name
Parameters can be fault codes, inputs to, or specific
outputs from, a vehicle control module.
The number of parameters selectable is limited to 32.
If the number of parameters available for customization
exceeds the d isplay
area,
the arrow buttons wi
11
be present,
allowing display area scrolling.
The parameters declared to Datalogger are initially
presented in alphabetical order.
Record Enabled
Record enabled is used to select which signals are to be
recorded.
To select a signal for recording, touch the rectangle next
to the signal name.
The record button will then be displayed.
Nofe:
Additional rectangles may appear in other columns
beside a selected signal name, indicating that the signal
units may be changed or that the signal may be used
as
a
trigger.
It should be noted that the more parameters you select to
record the slower the PDU's sample rate will be for each
parameter e.g. The PDU may be able to monitor six
parameters sampling each parameter twice a second. If
the number of parameters is increased to twelve then the
PDU would only be able to sample each parameter once
per second, thus reducing its ability to capture fast faults;
therefore it
is
recommended that the number of parameters
is kept to a minimum.
Display Order
Parameters may be displayed on the waveform/ bargraph
screen in any order.
To set the parameter display order, press the required
rectangle to create a numbered list.
Note: It
is
not
necessary to
display all of the parameters
required to be recorded.
This has particular benefits if a parameter is to be used as
a trigger but is not required to be displayed.
Trigger Action
For a detailed description of trigger action, refer to the
Trigger Customisation description on the following page.
S.I.
Units
Certain parameters can be measured / displayed in a
number of different units eg temperature in °C or °F. If a
rectangle appears around the displayed units in the
'S.I.'
column then the units are selectable. Each time the
rectangle is pressed, the selectable units scroll one step
through the available options.
Other Features
To make parameter customization easier two icons have
been introduced on to the bottom of the screen, these are:
This icon simply puts all ofthesignals selected for
recording in alphabetical order irrespective of
the language.
A B C
This icon will put all of the signals selected for
recording at the top of the parameter list in
numerical order.
^T/^
After the parameter customization process is completed,
return to the Datalogger main menu.
Default Customisation
To cancel all customisations, press the
Customisation Reset
icon.
This will reset the
customisation on all parameters to the default
setting.
Trigger Customisation
Datalogger operates using a 'rolling memory'.
When the Record icon is selected on the waveform
display, PDU will start to record data, it will then continue
to record data until its memory is
full.
At this point it will continue recording by overriding the
oldest
data.
This process will continue indefinitely or until
the trigger is activated.
When the trigger is activated it performs a number of
functions.
a) The first function istoplaceazerotimepointwithin
the stored data, this enables the trigger point to be
easily accessible in later stages.
b) The second function is to set a timer, ensuring that
the PDU wil
I
only continue recording for the time
selected in 'test-duration'.
September 1996 9-57
Page 410 of 421
^^?
The Aston Martin Lagonda Diagnostic System
Users Guide
The following trigger options are available:
Triggers when the signal passes above
a
specified
value,
i.e. stop lamp.
Triggers when the signal passes below
a
specified
value,
i.e. Anti-Lock brakes warning lamp.
Triggers when the signa
I
passes outside
a
specified
band,
i.e. oxygen sensor feedback.
Triggers when the signal passes into a specified
band.
Once the type of trigger has been selected the trigger
vaiue(s) (i.e. the signal level at which the trigger point wil
I
occur) should be set.
These values are set by highlighting the existing value.
i
ECT ^ 1
Trigger KBIT" ^
^^^^1
S.I.
°c
Oj
Engine coolant temperature
m
^
Highlighted Trigger Value
Press the calculator-style
icon.
A new screen should now be displayed.
Trigger Value Entry
Enter the required trigger value using the calculator-style
screen buttons.
The S.I. button enables unit selection, where applicable,
refer to S.I. Units.
Confirm the trigger value by pressing the 'tick'
icon.
The trigger screen will now be re-displayed.
Press the 'tick' icon to go back to the Parameter
Customisation screen.
Press the 'tick' icon again to return to the datalogger main
menu.
September 1996 9-59