change time MERCEDES-BENZ GLC-Class 2016 X253 Comand Manual
[x] Cancel search | Manufacturer: MERCEDES-BENZ, Model Year: 2016, Model line: GLC-Class, Model: MERCEDES-BENZ GLC-Class 2016 X253Pages: 222, PDF Size: 6.39 MB
Page 203 of 222

Bear in mind that at a speed of only 30 mph
(approximately 50 km/h) your vehicle covers
a distance of 44 feet (approximately 14m)
ever yse cond.
General notes
Notes on discs
!Do not affix stickers or labels to the discs.
They could peel off and damage COMAND.
Stickers can cause the disc to bend, which
can result in read errors and disc recogni-
tion problems.
!COMAND is designed to play discs that
comply with the EN 60908 standard. There- fore, you can only use discs with a maxi-
mum thickness of 1.3 mm.
If you insert thicker discs, e.g. those that
contain data on both sides (DVD on one
side and audio data on the other), they can-
not be ejected and can damage the device.
Only use round discs with a diameter of
12 cm. Do not use discs with a diameter of
8 cm, even with an adapter.
The variety of data media, burners and burn
software means there is no guarantee that
the system will be able to play discs that you
have copied yourself.
DVD playback conditions
If video DVDs do not conform to the NTSC or
PAL TV standards, they may create picture,
sound or other problems during playback.
COMAND is capable of playing back video
DVDs produced according to the following
standards:
RRegion code 1 or region code 0 (no region
code)
RPAL or NTSC standard
You will generally find the relevant details
either on the DVD itself or on the DVD case.
iIf you insert a video DVD with a different
region code, a message to this effect
appears.
iCOMAND is set to region code 1 at the
factory. This setting can be changed at an
authorized Mercedes-Benz Center. It is also
possible to play video DVDs with a different
region code, provided that they are pro-
duced in accordance with the PAL or NTSC
TV standard. The region code can be
changed up to five times.
Control options
There are four control menus available in
video DVD mode.
Most DVDs have their own control menu.
The DVD's control menu is operated directly
using the controller or DVD functions.
Control menu and
functionOperation
RDVD's control
menu
Selection of title,
scene, language,
subtitles ...Operation with the
controller
RMenu Options
Selection of
brightness, con-
trast, color, for-
mat
Operation using the
menu bar options,
video settings
RVideo menu
Selection of
scene, fast
forward or rewindIn full-screen mode,
slide6the con-
troller
RDVD functions
Selection of title,
scene, language,
subtitles ...In full-screen mode,
press the controller
Video DVD mode201
Media
Z
Page 219 of 222

Sample displays of weather data in the
map
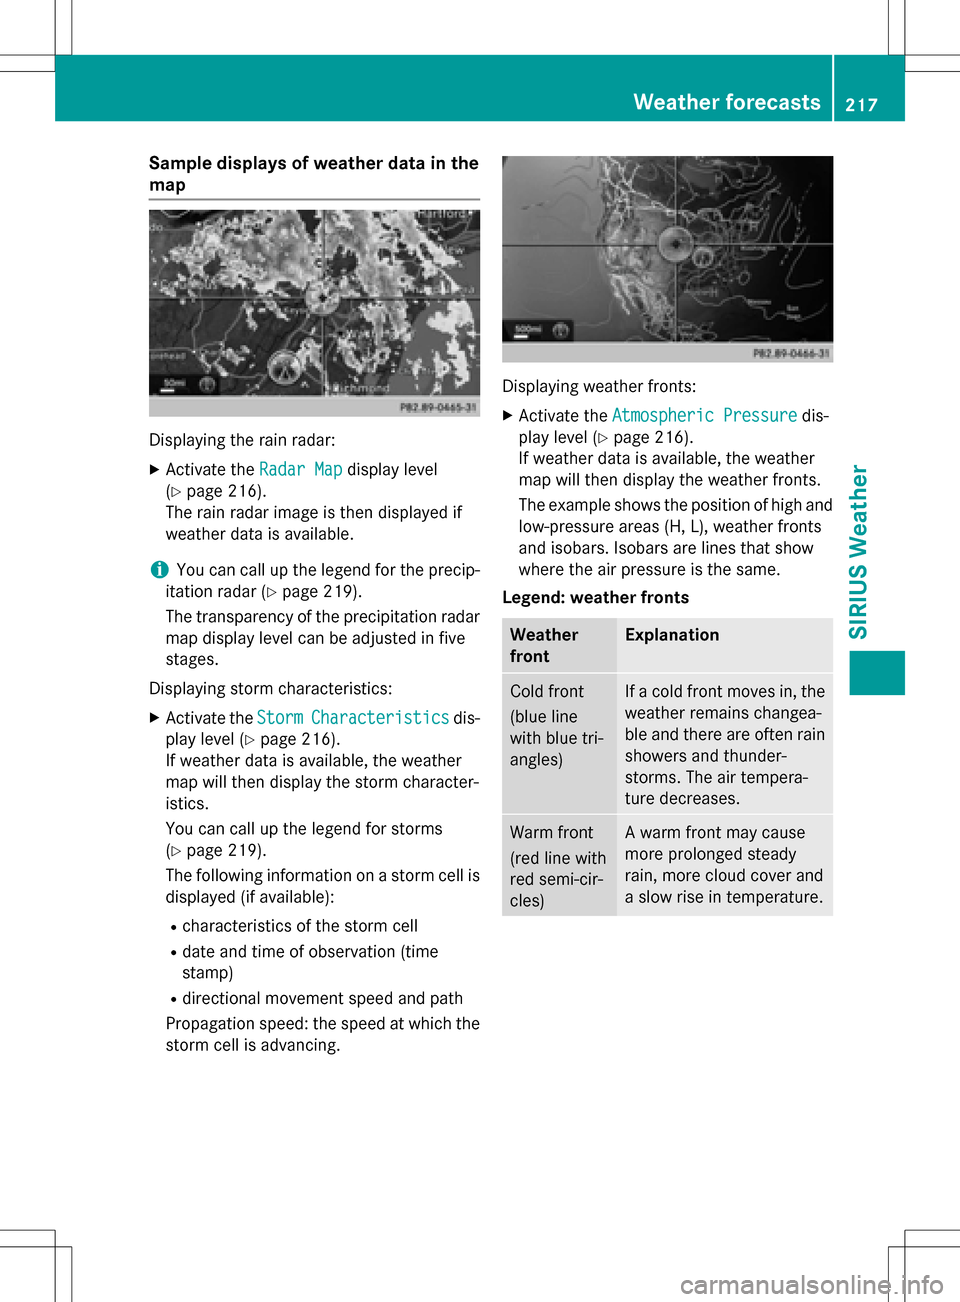
Displaying the rain radar:
XActivate theRadar Mapdisplay level
(
Ypage 216).
The rain radar image is then displayed if
weather data is available.
iYou can call up the legend for the precip-
itation radar (
Ypage 219).
The transparency of the precipitation radar
map display level can be adjusted in five
stages.
Displaying storm characteristics:
XActivate the StormCharacteristicsdis-
play level (
Ypage 216).
If weather data is available, the weather
map will then display the storm character-
istics.
You can call up the legend for storms
(
Ypage 219).
The following information on a storm cell is
displayed (if available):
Rcharacteristics of the storm cell
Rdate and time of observation (time
stamp)
Rdirectional movement speed and path
Propagation speed: the speed at which the
storm cell is advancing.
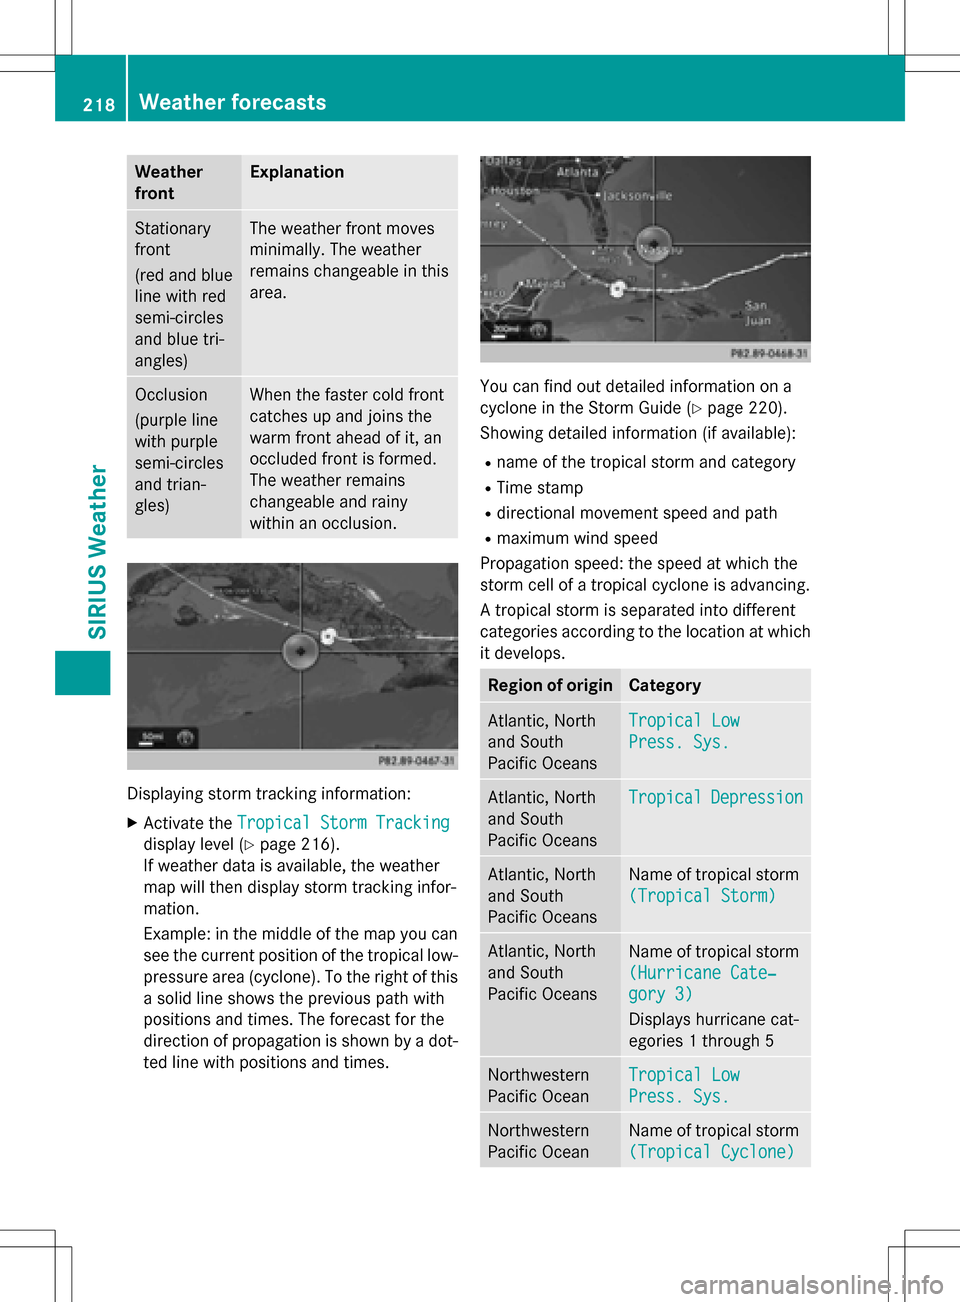
Displaying weather fronts:
XActivate the Atmospheric Pressuredis-
play level (
Ypage 216).
If weather data is available, the weather
map will then display the weather fronts.
The example shows the position of high and
low-pressure areas (H, L), weather fronts
and isobars. Isobars are lines that show
where the air pressure is the same.
Legend: weather fronts
Weather
frontExplanation
Cold front
(blue line
with blue tri-
angles)If a cold front moves in, the
weather remains changea-
ble and there are often rain
showers and thunder-
storms. The air tempera-
ture decreases.
Warm front
(red line with
red semi-cir-
cles)A warm front may cause
more prolonged steady
rain, more cloud cover and
a slow rise in temperature.
Weather forecasts217
SIRIUS Weather
Page 220 of 222

Weather
frontExplanation
Stationary
front
(red and blue
line with red
semi-circles
and blue tri-
angles)The weather front moves
minimally. The weather
remains changeable in this
area.
Occlusion
(purple line
with purple
semi-circles
and trian-
gles)When the faster cold front
catches up and joins the
warm front ahead of it, an
occluded front is formed.
The weather remains
changeable and rainy
within an occlusion.
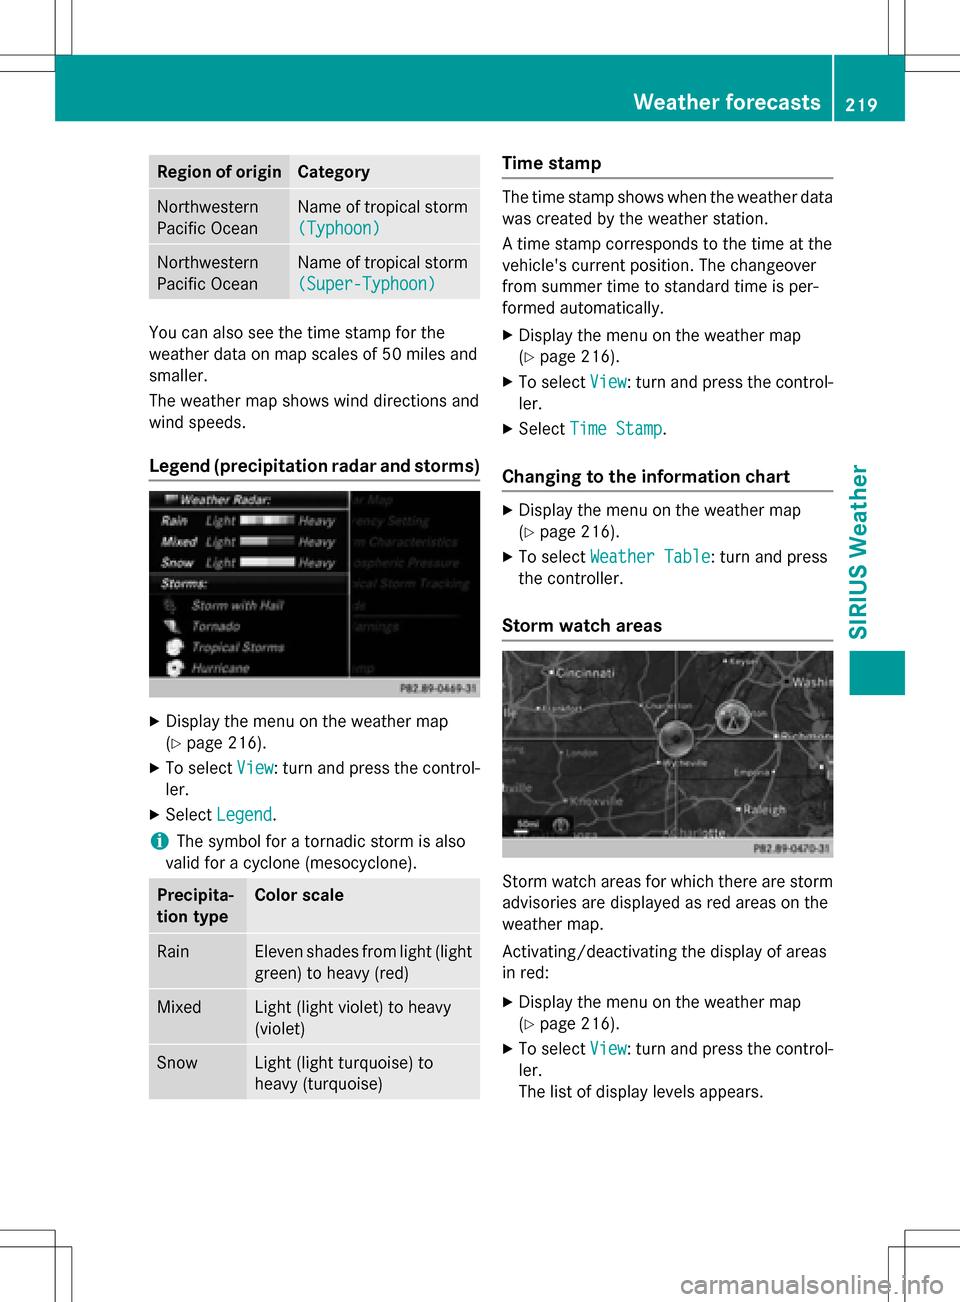
Displaying storm tracking information:
XActivate theTropical Storm Tracking
display level (Ypage 216).
If weather data is available, the weather
map will then display storm tracking infor-
mation.
Example: in the middle of the map you can see the current position of the tropical low-
pressure area (cyclone). To the right of this
a solid line shows the previous path with
positions and times. The forecast for the
direction of propagation is shown by a dot-
ted line with positions and times.
You can find out detailed information on a
cyclone in the Storm Guide (
Ypage 220).
Showing detailed information (if available):
Rname of the tropical storm and category
RTime stamp
Rdirectional movement speed and path
Rmaximum wind speed
Propagation speed: the speed at which the
storm cell of a tropical cyclone is advancing.
A tropical storm is separated into different
categories according to the location at which
it develops.
Region of originCategory
Atlantic, North
and South
Pacific OceansTropical Low
Press. Sys.
Atlantic, North
and South
Pacific OceansTropicalDepression
Atlantic, North
and South
Pacific OceansName of tropical storm
(Tropical Storm)
Atlantic, North
and South
Pacific OceansName of tropical storm
(Hurricane Cate‐
gory 3)
Displays hurricane cat-
egories 1 through 5
Northwestern
Pacific OceanTropical Low
Press. Sys.
Northwestern
Pacific OceanName of tropical storm
(Tropical Cyclone)
218Weather forecasts
SIRIUS Weather
Page 221 of 222

Region of originCategory
Northwestern
Pacific OceanName of tropical storm
(Typhoon)
Northwestern
Pacific OceanName of tropical storm
(Super-Typhoon)
You can also see the time stamp for the
weather data on map scales of 50 miles and
smaller.
The weather map shows wind directions and
wind speeds.
Legend (precipitation radar and storms)
XDisplay the menu on the weather map
(
Ypage 216).
XTo selectView: turn and press the control-
ler.
XSelect Legend.
iThe symbol for a tornadic storm is also
valid for a cyclone (mesocyclone).
Precipita-
tion typeColor scale
RainEleven shades from light (light
green) to heavy (red)
MixedLight (light violet) to heavy
(violet)
SnowLight (light turquoise) to
heavy (turquoise)
Time stamp
The time stamp shows when the weather data
was created by the weather station.
A time stamp corresponds to the time at the
vehicle's current position. The changeover
from summer time to standard time is per-
formed automatically.
XDisplay the menu on the weather map
(
Ypage 216).
XTo select View: turn and press the control-
ler.
XSelect Time Stamp.
Changing to the information chart
XDisplay the menu on the weather map
(
Ypage 216).
XTo select Weather Table: turn and press
the controller.
Storm watch areas
Storm watch areas for which there are storm
advisories are displayed as red areas on the
weather map.
Activating/deactivating the display of areas
in red:
XDisplay the menu on the weather map
(
Ypage 216).
XTo select View: turn and press the control-
ler.
The list of display levels appears.
Weather forecasts219
SIRIUS Weather