MERCEDES-BENZ S-Class SEDAN 2016 W222 Comand Manual
Manufacturer: MERCEDES-BENZ, Model Year: 2016, Model line: S-Class SEDAN, Model: MERCEDES-BENZ S-Class SEDAN 2016 W222Pages: 298, PDF Size: 9.16 MB
Page 261 of 298
XTo display the main function bar:slide
5 the controller.
XTo select ®, turn and press the controller.
The online applications menu appears.
XTo select SIRIUS Weather, turn and press
the controller.
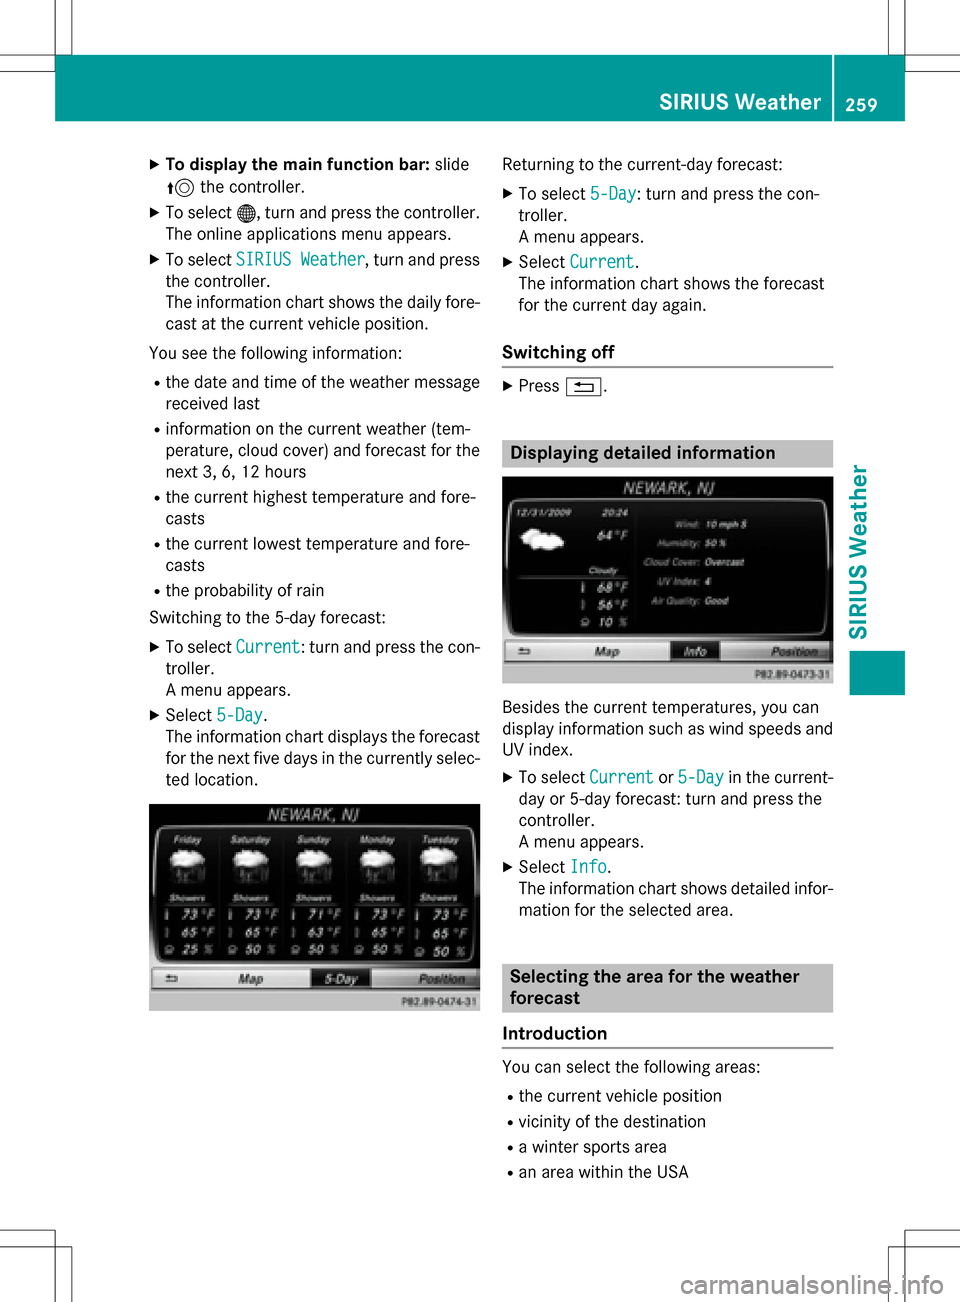
The information chart shows the daily fore-
cast at the current vehicle position.
You see the following information:
Rthe date and time of the weather message
received last
Rinformation on the current weather (tem-
perature, cloud cover) and forecast for the
next 3, 6, 12 hours
Rthe current highest temperature and fore-
casts
Rthe current lowest temperature and fore-
casts
Rthe probability of rain
Switching to the 5-day forecast:
XTo select Current: turn and press the con-
troller.
A menu appears.
XSelect 5-Day.
The information chart displays the forecast
for the next five days in the currently selec-
ted location.
Returning to the current-day forecast:
XTo select 5-Day: turn and press the con-
troller.
A menu appears.
XSelect Current.
The information chart shows the forecast
for the current day again.
Switching off
XPress %.
Displaying detailed information
Besides the current temperatures, you can
display information such as wind speeds and
UV index.
XTo select Currentor5-Dayin the current-
day or 5-day forecast: turn and press the
controller.
A menu appears.
XSelect Info.
The information chart shows detailed infor-
mation for the selected area.
Selecting the area for the weather
forecast
Introduction
You can select the following areas:
Rthe current vehicle position
Rvicinity of the destination
Ra winter sports area
Ran area within the USA
SIRIUS Weather259
SIRIUS Weather
Page 262 of 298
You can select a location in the information
chart (option 1) or in the map (option 2). You
also have the option of selecting a location
from the memory (
Ypage 261). In order to
select a location from the memory, you must
have previously saved a location.
iCOMAND receives weather forecast data
from the nearest weather station at the
selected location.
Option 1: selecting the area in the infor-
mation chart
XTo select Positionin the information
chart: turn and press the controller.
XTo select the current vehicle position:
select Current Position
in the menu.
COMAND receives the weather data for the
current vehicle position from the nearest
weather station and displays it automati-
cally.
Requirement for "Near destination": a route
to a destination has been calculated
(
Ypage 90). The menu item is otherwise
grayed out.
XTo select the vicinity of the destination:
select Near Destination
: turn and press
the controller.
XTo select a winter sports area: selectAt
SkiAreafrom the menu: turn the control-
ler and press to confirm.
XSelect a state, e.g. Colorado.
XSelect a winter sports area from the menu.
The weather data and other information is
displayed for the winter sports area that has been selected. The data is supplied by
the nearest weather station.
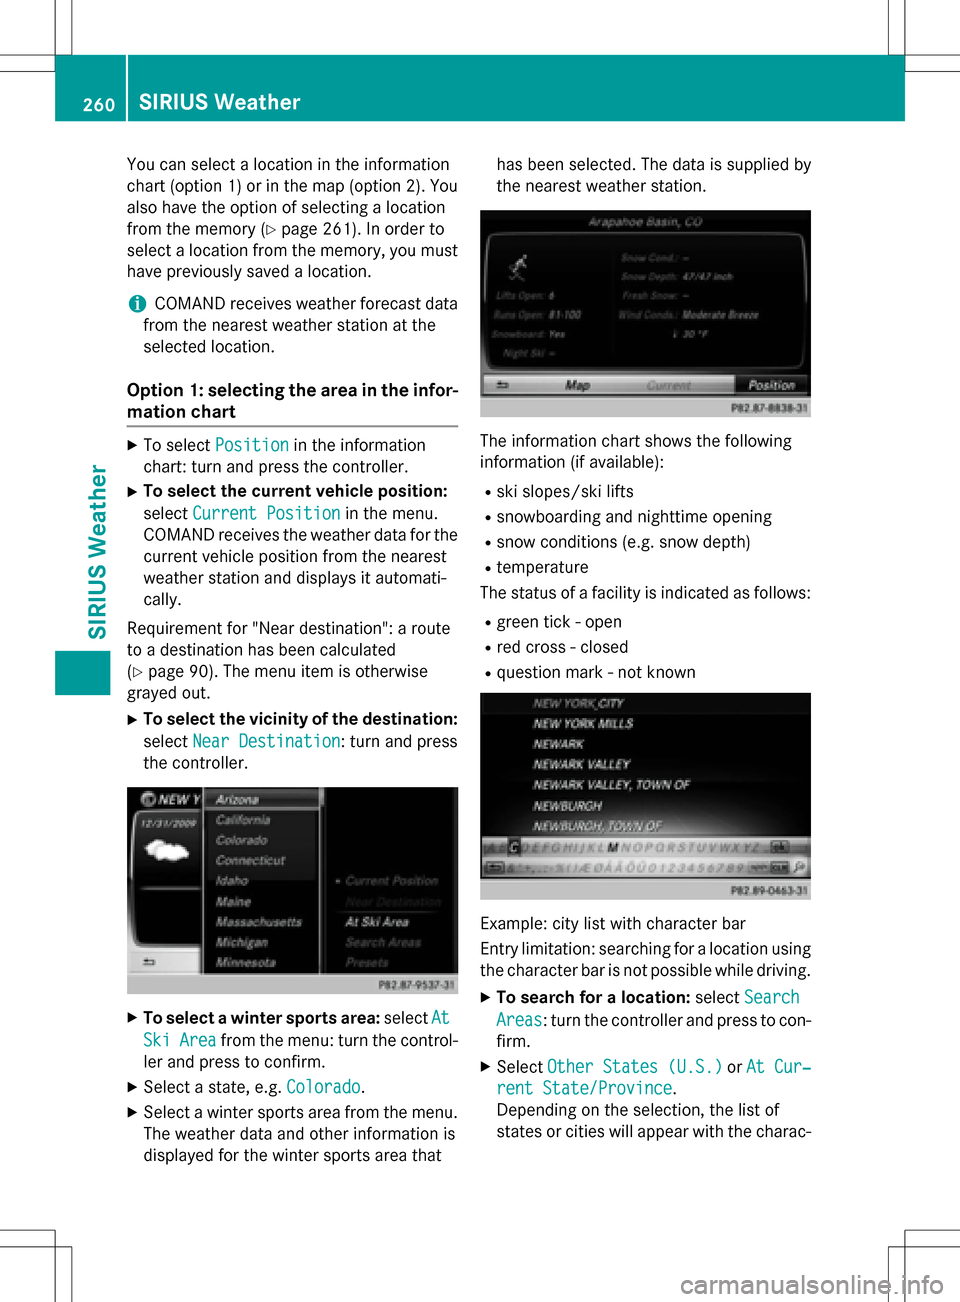
The information chart shows the following
information (if available):
Rski slopes/ski lifts
Rsnowboarding and nighttime opening
Rsnow conditions (e.g. snow depth)
Rtemperature
The status of a facility is indicated as follows:
Rgreen tick - open
Rred cross - closed
Rquestion mark - not known
Example: city list with character bar
Entry limitation: searching for a location using
the character bar is not possible while driving.
XTo search for a location: selectSearch
Areas: turn the controller and press to con-
firm.
XSelect Other States (U.S.)orAt Cur‐
rent State/Province.
Depending on the selection, the list of
states or cities will appear with the charac-
260SIRIUS Weather
SIRIUS Weather
Page 263 of 298
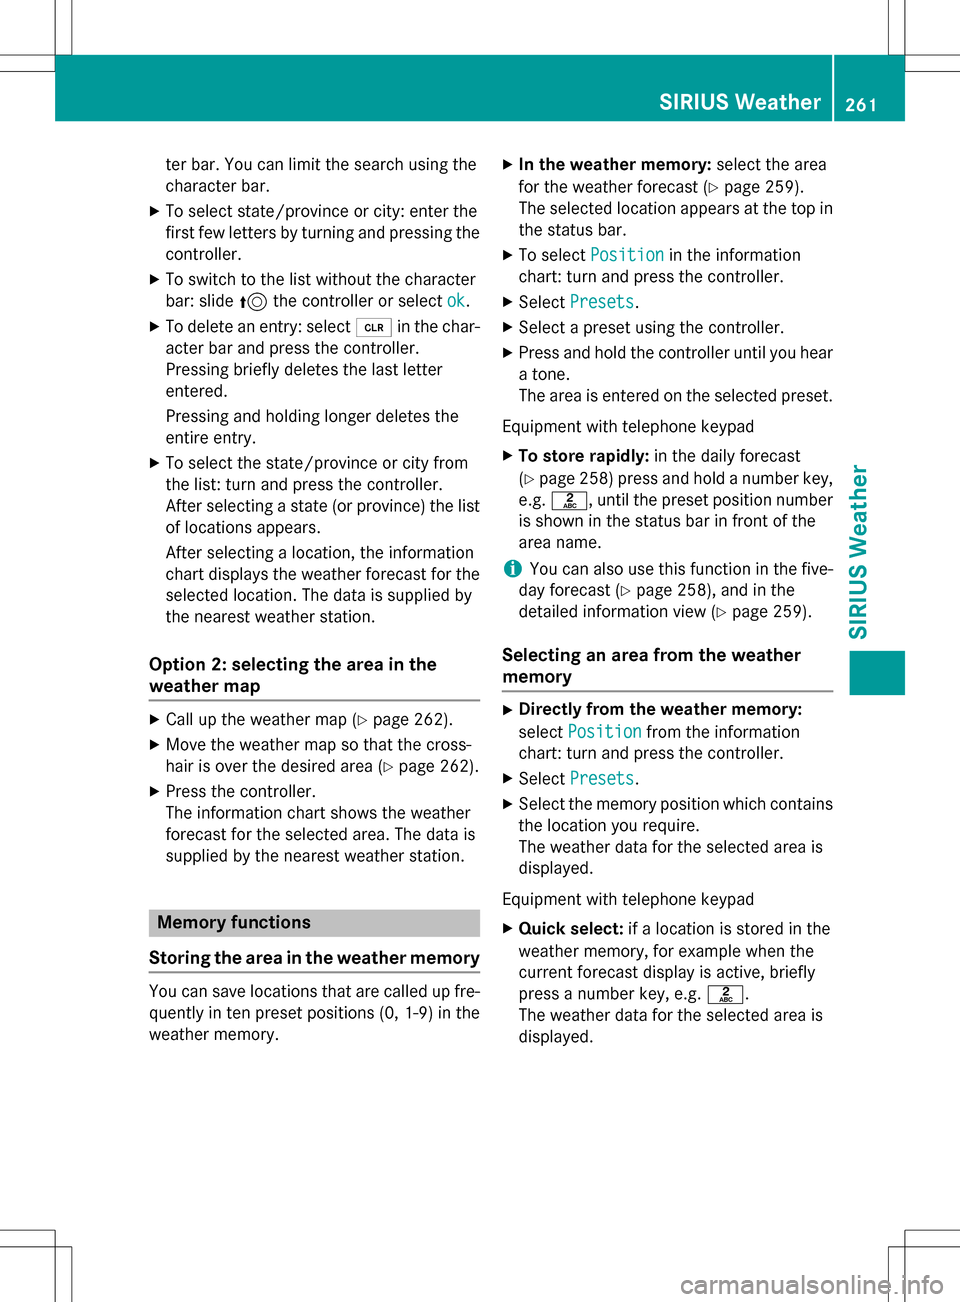
ter bar. You can limit the search using the
character bar.
XTo select state/province or city: enter the
first few letters by turning and pressing the
controller.
XTo switch to the list without the character
bar: slide 5the controller or select ok
.
XTo delete an entry: select 2in the char-
acter bar and press the controller.
Pressing briefly deletes the last letter
entered.
Pressing and holding longer deletes the
entire entry.
XTo select the state/province or city from
the list: turn and press the controller.
After selecting a state (or province) the list
of locations appears.
After selecting a location, the information
chart displays the weather forecast for the
selected location. The data is supplied by
the nearest weather station.
Option 2: selecting the area in the
weather map
XCall up the weather map (Ypage 262).
XMove the weather map so that the cross-
hair is over the desired area (
Ypage 262).
XPress the controller.
The information chart shows the weather
forecast for the selected area. The data is
supplied by the nearest weather station.
Memory functions
Storing the area in the weather memory
You can save locations that are called up fre-
quently in ten preset positions (0, 1-9) in the
weather memory.
XIn the weather memory: select the area
for the weather forecast (
Ypage 259).
The selected location appears at the top in
the status bar.
XTo select Positionin the information
chart: turn and press the controller.
XSelect Presets.
XSelect a preset using the controller.
XPress and hold the controller until you hear
a tone.
The area is entered on the selected preset.
Equipment with telephone keypad
XTo store rapidly: in the daily forecast
(
Ypage 258 )press and hold a number key,
e.g. l, until the preset position number
is shown in the status bar in front of the
area name.
iYou can also use this function in the five-
day forecast (
Ypage 258), and in the
detailed information view (
Ypage 259).
Selecting an area from the weather
memory
XDirectly from the weather memory:
select Position
from the information
chart: turn and press the controller.
XSelect Presets.
XSelect the memory position which contains
the location you require.
The weather data for the selected area is
displayed.
Equipment with telephone keypad
XQuick select: if a location is stored in the
weather memory, for example when the
current forecast display is active, briefly
press a number key, e.g. l.
The weather data for the selected area is
displayed.
SIRIUS Weather261
SIRIUS Weather
Page 264 of 298
Weather map
Calling up the weather map
XTo select Mapin the information chart: turn
and press the controller.
The weather map is shown on a 500-mi
(500-km) scale.
Moving the weather map
XSlide 4 or1 the controller.
The weather map moves in the correspond-
ing direction under the crosshair.
Changing the scale
XTurn the controller.
The scale bar appears.
XTurn until the desired scale is set.
Showing/hiding the menu in the
weather map
XTo show: press the controller.
XTo hide:slide5the controller.
Selecting a weather station in the map
XMove the weather map and crosshair to the
desired position (
Ypage 262).
XTo show the menu: press the controller.
XTo select Weather Table: press the con-
troller.
COMAND receives the weather data for the
selected position from the nearest weather
station and displays it automatically as a
daily forecast.
Switching layers on the map on/off
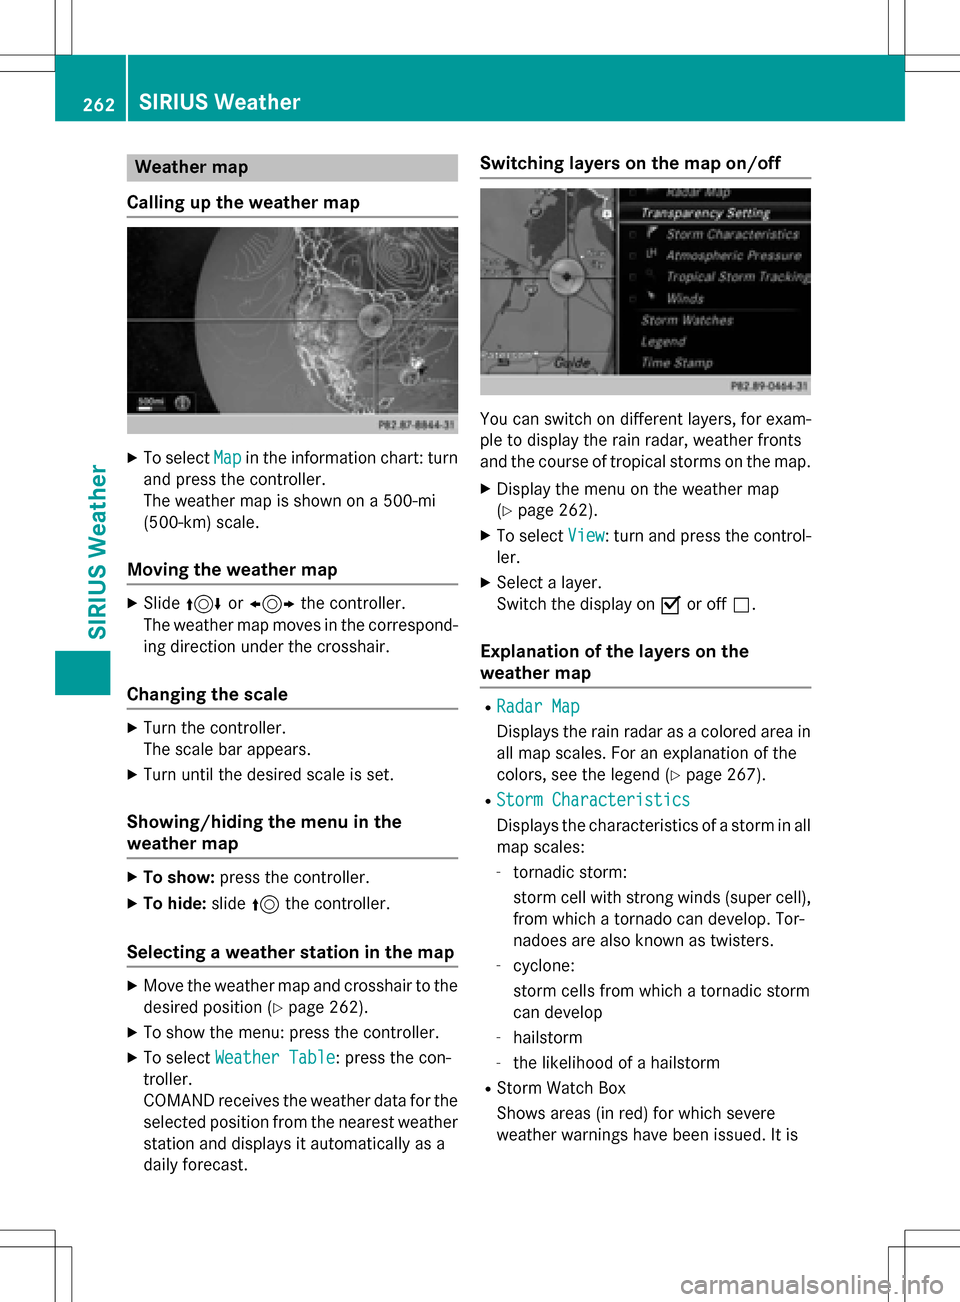
You can switch on different layers, for exam-
ple to display the rain radar, weather fronts
and the course of tropical storms on the map.
XDisplay the menu on the weather map
(
Ypage 262).
XTo select View: turn and press the control-
ler.
XSelect a layer.
Switch the display on Oor off ª.
Explanation of the layers on the
weather map
RRadar Map
Displays the rain radar as a colored area in
all map scales. For an explanation of the
colors, see the legend (
Ypage 267).
RStorm Characteristics
Displays the characteristics of a storm in all
map scales:
-tornadic storm:
storm cell with strong winds (super cell),
from which a tornado can develop. Tor-
nadoes are also known as twisters.
-cyclone:
storm cells from which a tornadic storm
can develop
-hailstorm
-the likelihood of a hailstorm
RStorm Watch Box
Shows areas (in red) for which severe
weather warnings have been issued. It is
262SIRIUS Weather
SIRIUS Weather
Page 265 of 298
shown in map scales 50 mi (50 km), 200 mi(200 km) and 500 mi (500 km).
RAtmospheric Pressure
Shows the position of high and low-pres-
sure areas (H, L), weather fronts and iso-
bars It is shown in map scales 200 mi
(200 km) and 500 mi (500 km).
RTropical Storm Tracking
Shows the direction and speed of propaga-
tion (track) of a tropical storm in all map
scales with information on times and inten-
sity.
RWinds
Shows the wind direction and wind speed in
map scale of 5 mi (5 km).
SIRIUS Weather263
SIRIUS Weather
Page 266 of 298
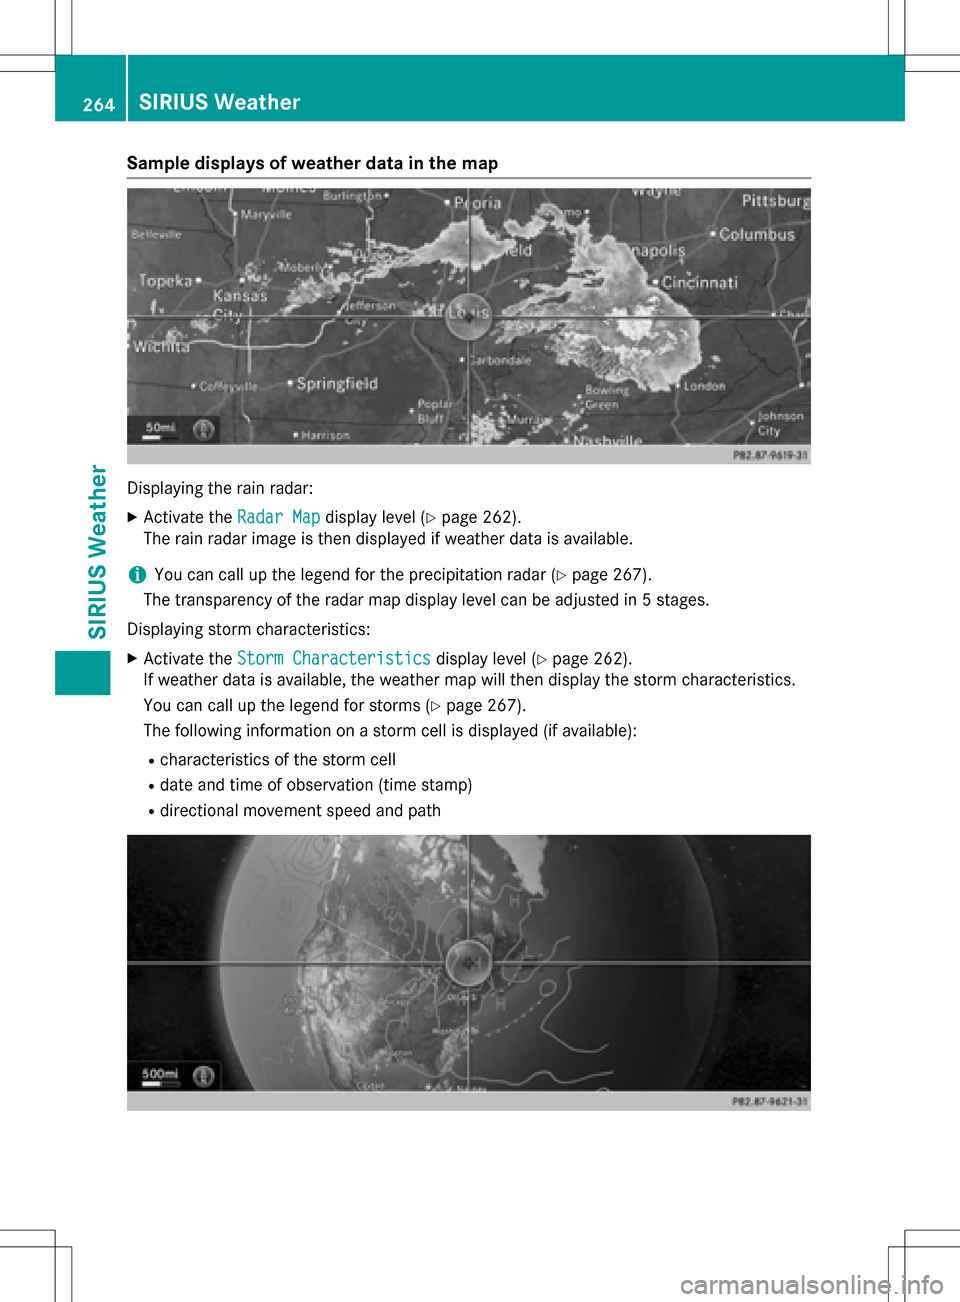
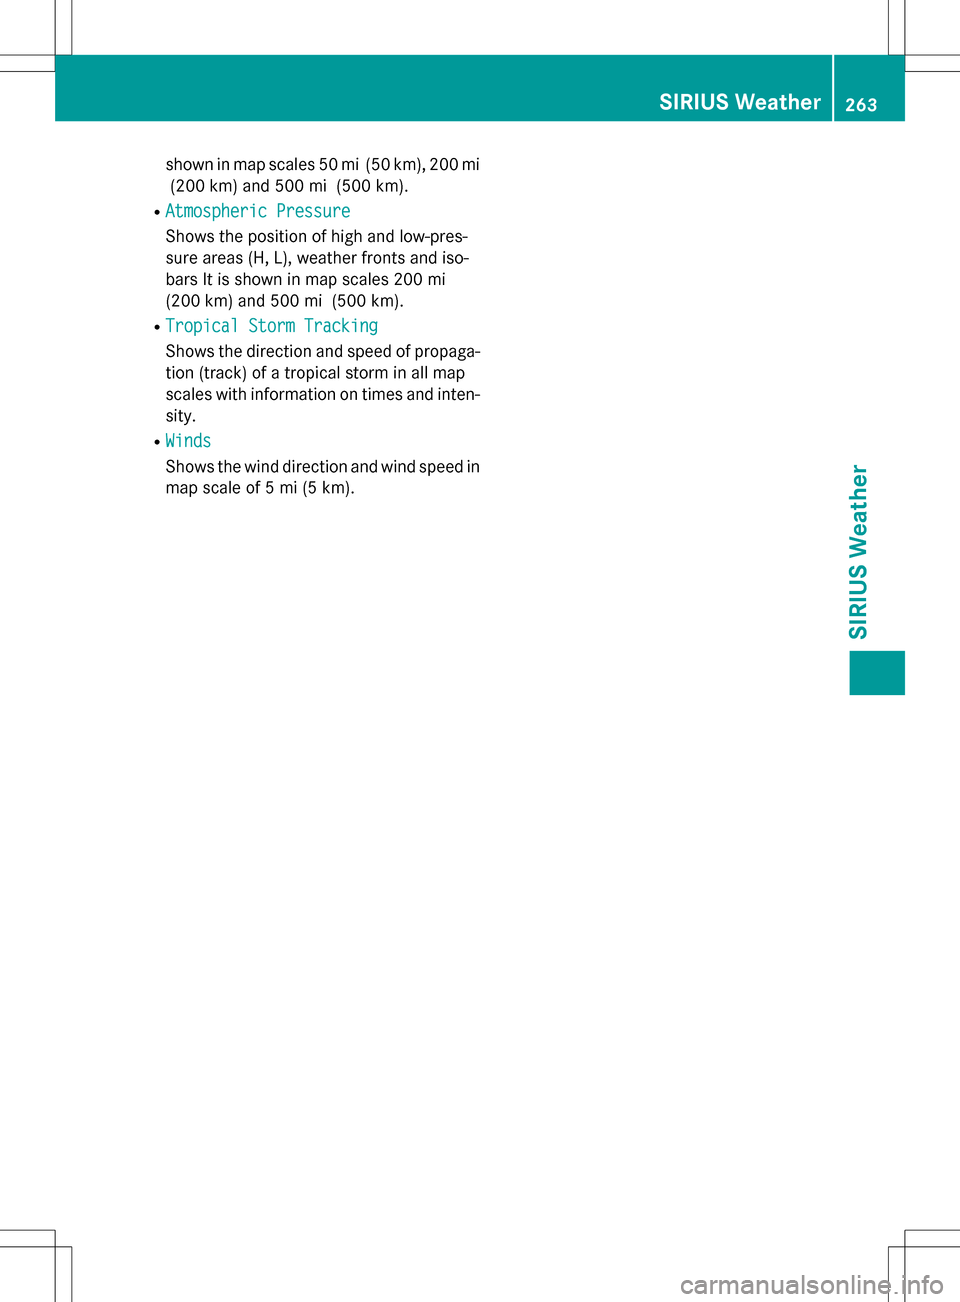
Sample displays of weather data in the map
Displaying the rain radar:
XActivate theRadar Mapdisplay level (Ypage 262).
The rain radar image is then displayed if weather data is available.
iYou can call up the legend for the precipitation radar (Ypage 267).
The transparency of the radar map display level can be adjusted in 5 stages.
Displaying storm characteristics:
XActivate the Storm Characteristicsdisplay level (Ypage 262).
If weather data is available, the weather map will then display the storm characteristics.
You can call up the legend for storms (
Ypage 267).
The following information on a storm cell is displayed (if available):
Rcharacteristics of the storm cell
Rdate and time of observation (time stamp)
Rdirectional movement speed and path
264SIRIUS Weather
SIRIUS Weather
Page 267 of 298
Displaying weather fronts:
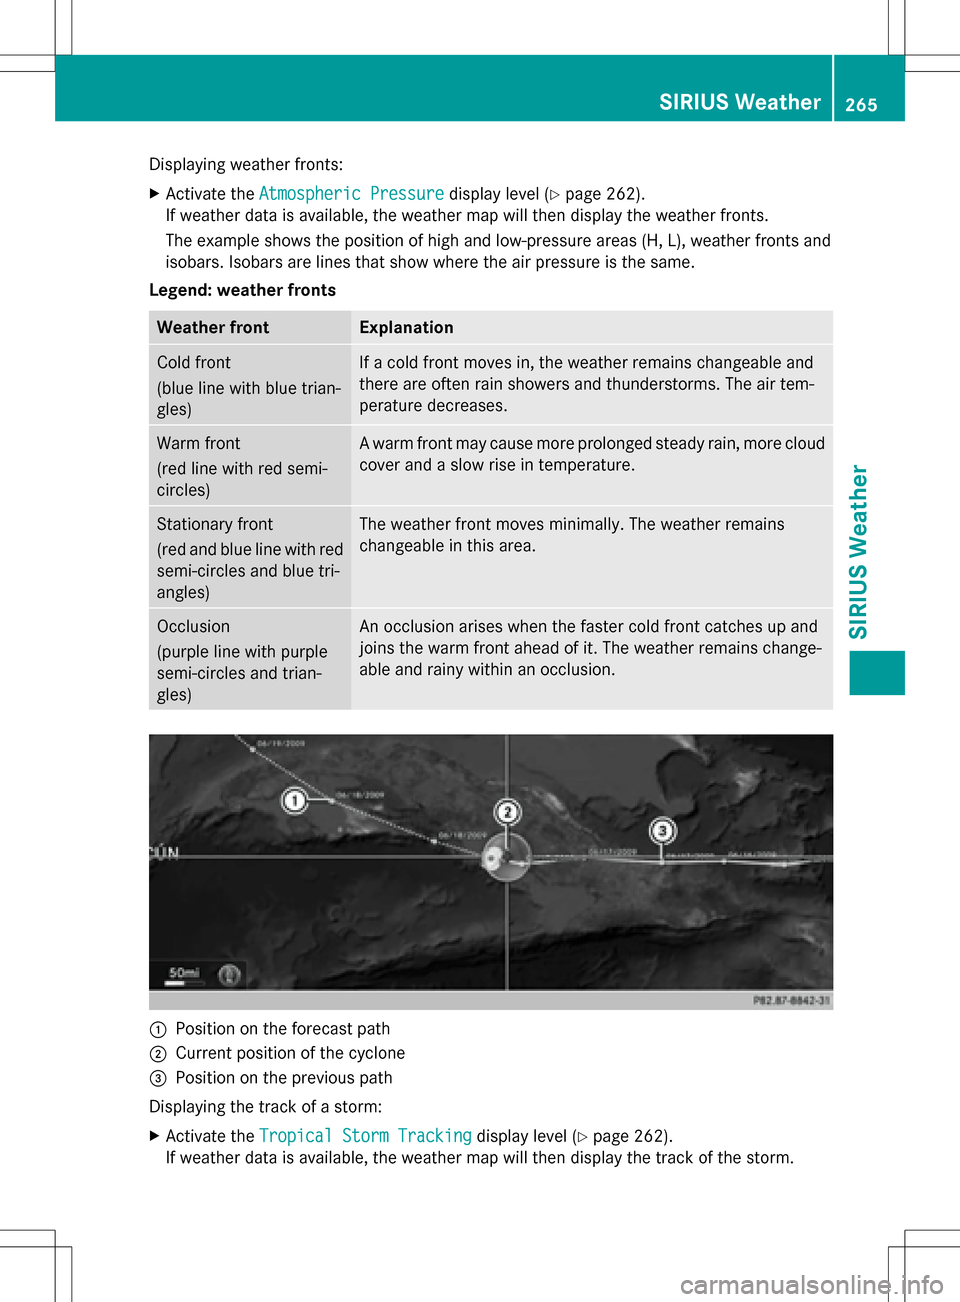
XActivate theAtmospheric Pressuredisplay level (Ypage 262).
If weather data is available, the weather map will then display the weather fronts.
The example shows the position of high and low-pressure areas (H, L), weather fronts and
isobars. Isobars are lines that show where the air pressure is the same.
Legend: weather fronts
Weather frontExplanation
Cold front
(blue line with blue trian-
gles)If a cold front moves in, the weather remains changeable and
there are often rain showers and thunderstorms. The air tem-
perature decreases.
Warm front
(red line with red semi-
circles)A warm front may cause more prolonged steady rain, more cloud
cover and a slow rise in temperature.
Stationary front
(red and blue line with red
semi-circles and blue tri-
angles)The weather front moves minimally. The weather remains
changeable in this area.
Occlusion
(purple line with purple
semi-circles and trian-
gles)An occlusion arises when the faster cold front catches up and
joins the warm front ahead of it. The weather remains change-
able and rainy within an occlusion.
:Position on the forecast path
;Current position of the cyclone
=Position on the previous path
Displaying the track of a storm:
XActivate the Tropical Storm Trackingdisplay level (Ypage 262).
If weather data is available, the weather map will then display the track of the storm.
SIRIUS Weather265
SIRIUS Weather
Page 268 of 298
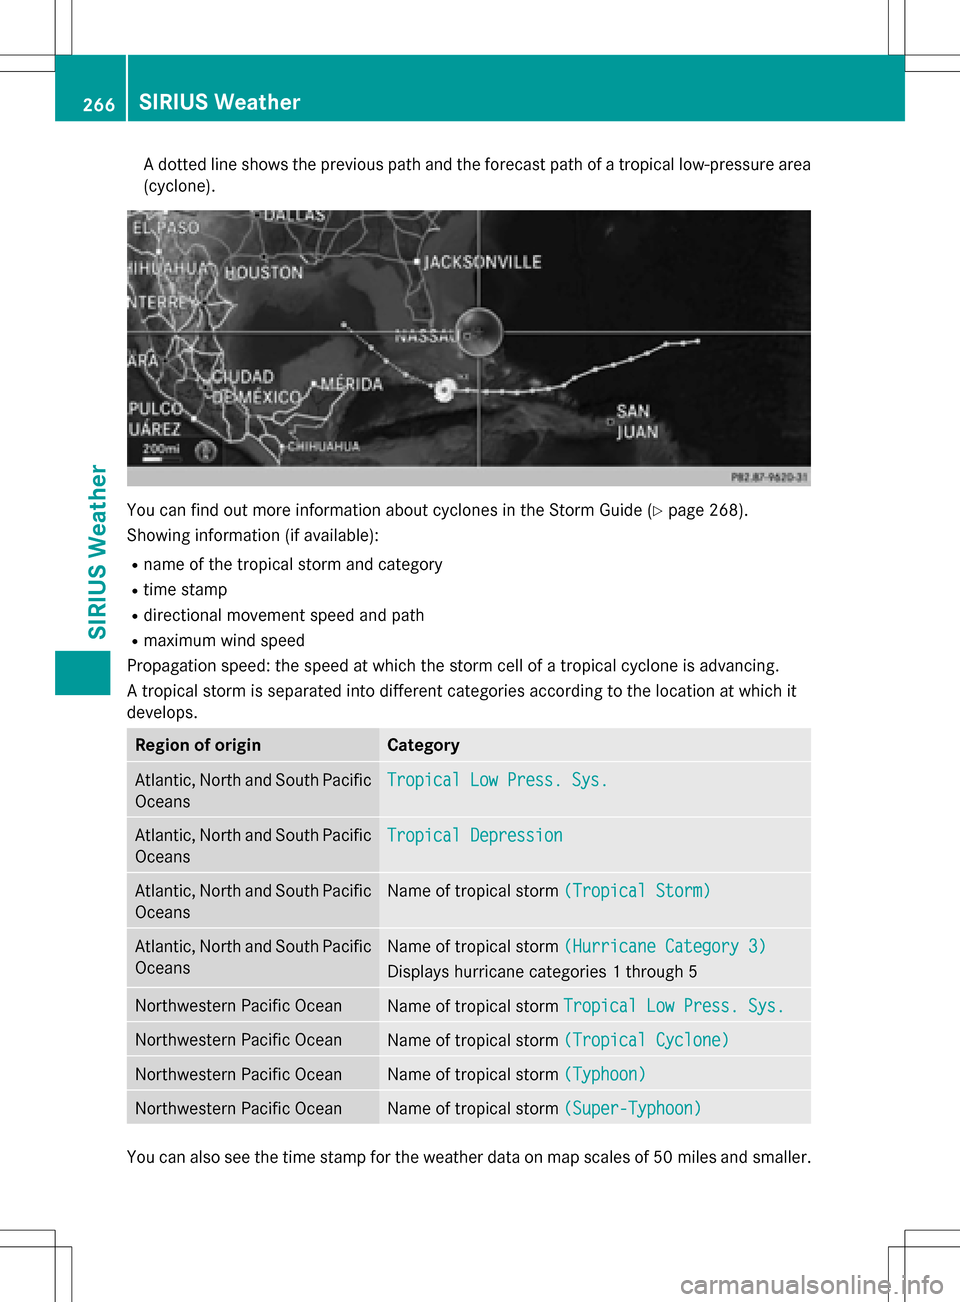
A dotted line shows the previous path and the forecast path of a tropical low-pressure area
(cyclone).
You can find out more information about cyclones in the Storm Guide (Ypage 268).
Showing information (if available):
Rname of the tropical storm and category
Rtime stamp
Rdirectional movement speed and path
Rmaximum wind speed
Propagation speed: the speed at which the storm cell of a tropical cyclone is advancing.
A tropical storm is separated into different categories according to the location at which it
develops.
Region of originCategory
Atlantic, North and South Pacific
OceansTropical Low Press. Sys.
Atlantic, North and South Pacific
OceansTropical Depression
Atlantic, North and South Pacific
OceansName of tropical storm (Tropical Storm)
Atlantic, North and South Pacific
OceansName of tropical storm(Hurricane Category 3)
Displays hurricane categories 1 through 5
Northwestern Pacific OceanName of tropical stormTropical Low Press. Sys.
Northwestern Pacific OceanName of tropical storm(Tropical Cyclone)
Northwestern Pacific OceanName of tropical storm(Typhoon)
Northwestern Pacific OceanName of tropical storm(Super-Typhoon)
You can also see the time stamp for the weather data on map scales of 50 miles and smaller.
266SIRIUS Weather
SIRIUS Weather
Page 269 of 298
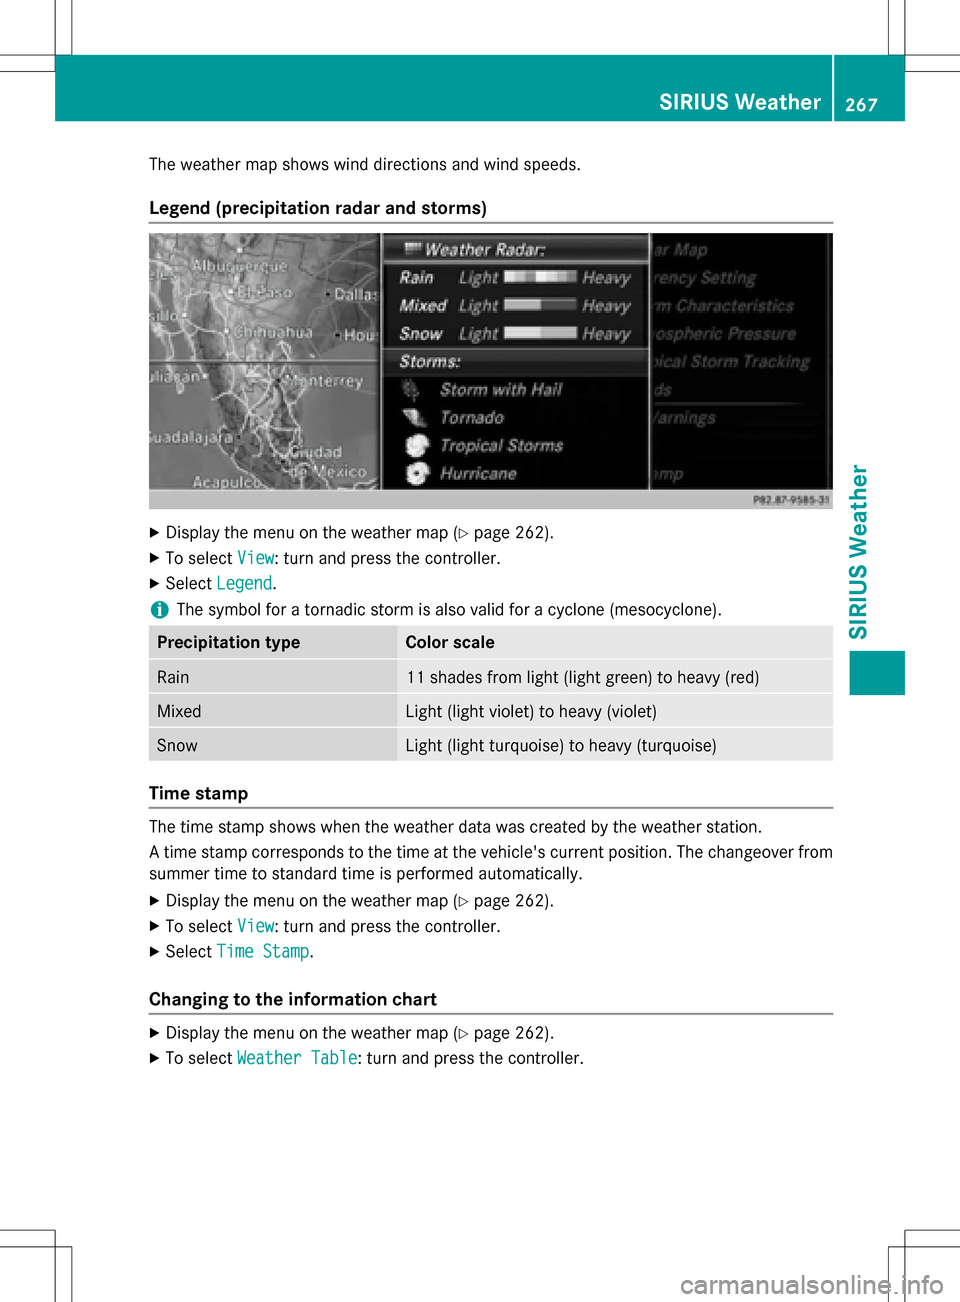
The weather map shows wind directions and wind speeds.
Legend (precipitation radar and storms)
XDisplay the menu on the weather map (Ypage 262).
XTo selectView: turn and press the controller.
XSelectLegend.
iThe symbol for a tornadic storm is also valid for a cyclone (mesocyclone).
Precipitation typeColor scale
Rain11 shades from light (light green) to heavy (red)
MixedLight (light violet) to heavy (violet)
SnowLight (light turquoise) to heavy (turquoise)
Time stamp
The time stamp shows when the weather data was created by the weather station.
A time stamp corresponds to the time at the vehicle's current position. The changeover from
summer time to standard time is performed automatically.
XDisplay the menu on the weather map (Ypage 262).
XTo select View: turn and press the controller.
XSelectTime Stamp.
Changing to the information chart
XDisplay the menu on the weather map (Ypage 262).
XTo select Weather Table: turn and press the controller.
SIRIUS Weather267
SIRIUS Weather
Page 270 of 298
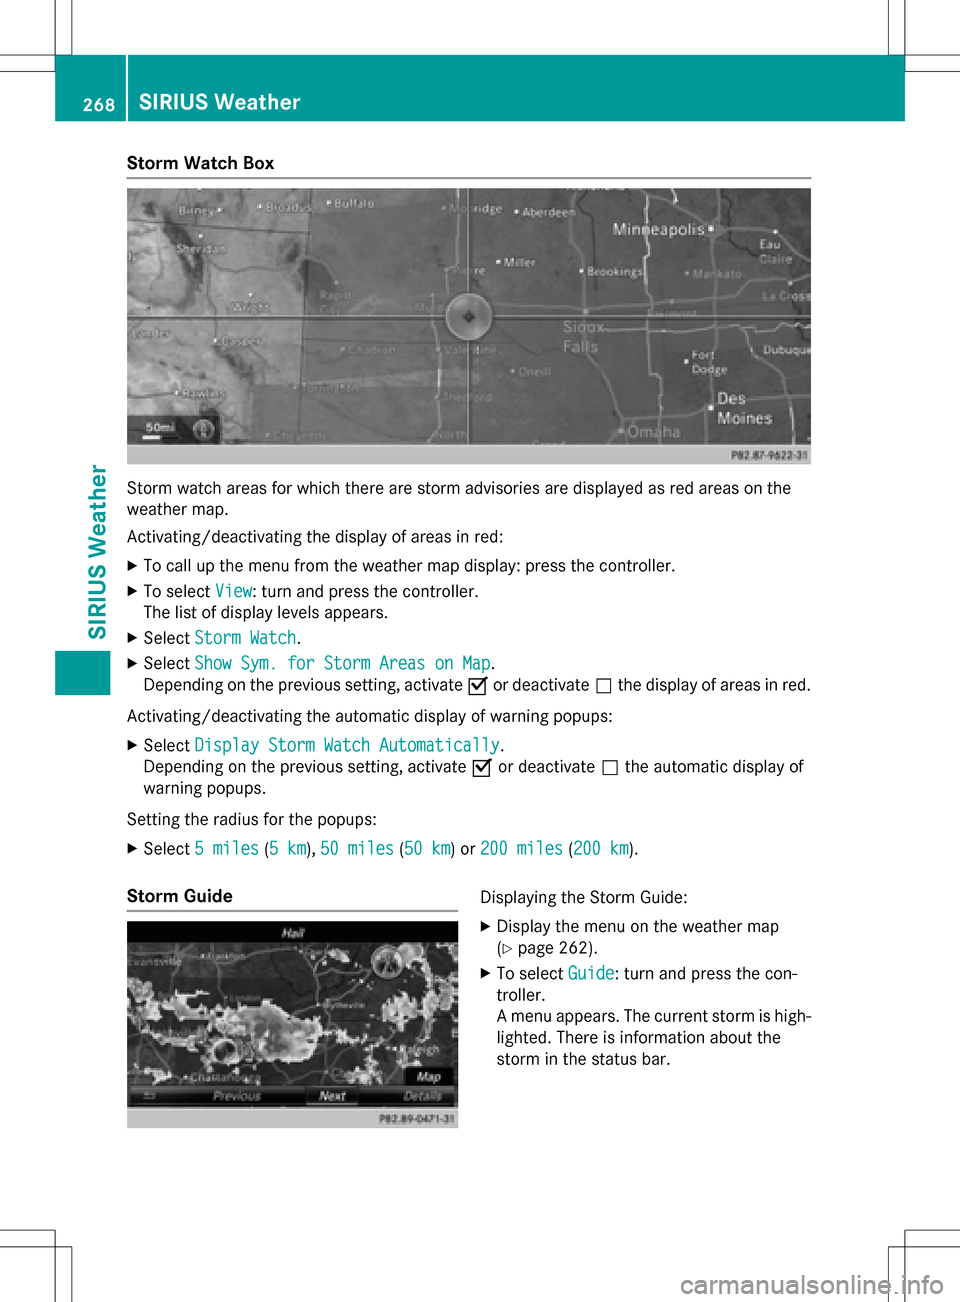
Storm Watch Box
Storm watch areas for which there are storm advisories are displayed as red areas on the
weather map.
Activating/deactivating the display of areas in red:
XTo call up the menu from the weather map display: press the controller.
XTo selectView: turn and press the controller.
The list of display levels appears.
XSelect Storm Watch.
XSelectShow Sym. for Storm Areas on Map.
Depending on the previous setting, activate Oor deactivate ªthe display of areas in red.
Activating/deactivating the automatic display of warning popups:
XSelect Display Storm Watch Automatically.
Depending on the previous setting, activate Oor deactivate ªthe automatic display of
warning popups.
Setting the radius for the popups:
XSelect 5 miles(5 km),50 miles(50 km) or 200 miles(200 km).
Storm GuideDisplaying the Storm Guide:
XDisplay the menu on the weather map
(
Ypage 262).
XTo select Guide: turn and press the con-
troller.
A menu appears. The current storm is high-
lighted. There is information about the
storm in the status bar.
268SIRIUS Weather
SIRIUS Weather