display ASTON MARTIN DB7 1997 Owner's Manual
[x] Cancel search | Manufacturer: ASTON MARTIN, Model Year: 1997, Model line: DB7, Model: ASTON MARTIN DB7 1997Pages: 421, PDF Size: 9.31 MB
Page 404 of 421
^7
The Aston Martin Lagonda Diagnostic System
Users Guide
Diagnostic Trouble Codes
Introduction
The 'Diagnostic trouble codes' application enables the
PDU to monitor the trouble codes logged in selected
control module's and provides the following functions:
• Decode and display any trouble codes logged by
the control module(s) being monitored.
• Decode and display enhanced diagnostic
information, together with any count of the number
of occurrences, when supported by the control
module(s).
• Clearsomeorallofallthesetroublecodes selected
by the user on the PDU screen, when supported by
the control module(s).
Diagnostic Trouble Codes are logged by the Engine
Management and by the Automatic Transmission control
units and can be accessed using the PDU. Logged codes
in the 95 MY Teves Mk II ABS controller can only be
accessed using the brake warning light. The Air
Conditioning control unit does not log trouble codes.
Operation
From the Main Menu make the following selections:
Select Diagnostics
Select Engine or Transmission
The system will then load the appropriate
software
Select Diagnostic Trouble Codes
Connect the PDU to the car as shown on the
screen diagram
Select the / icon to confirm connection
The PDU will then interrogate the chosen control
unit and will display any logged trouble codes.
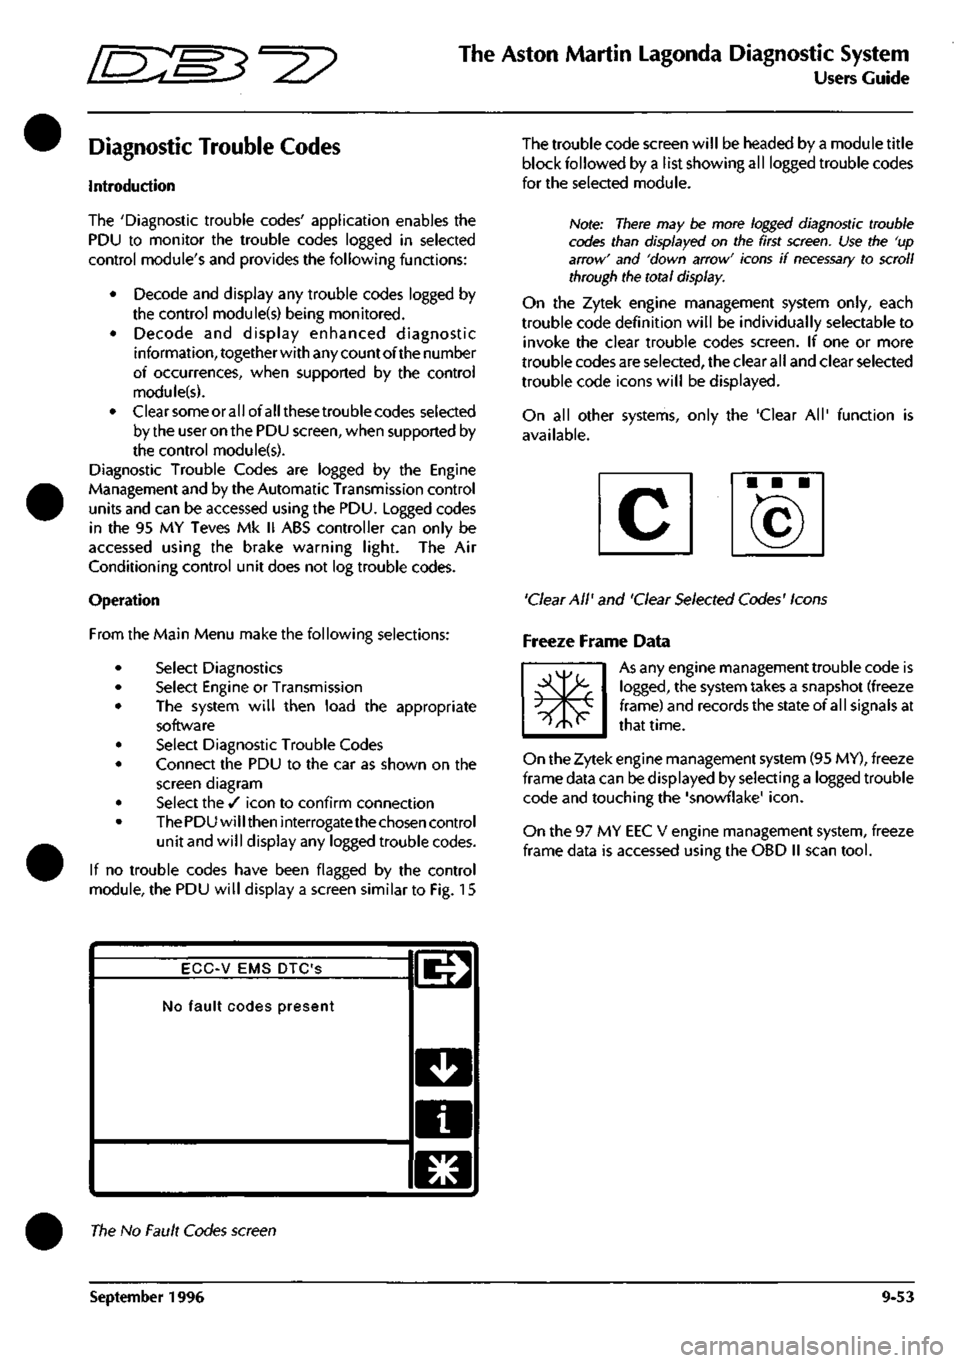
If no trouble codes have been flagged by the control
module, the PDU will display a screen similar to Fig. 15
The trouble code screen will be headed by a module title
block followed by a list showing all logged trouble codes
for the seleaed module.
Note: There may be more logged diagnostic trouble
codes than displayed on the first
screen.
Use the 'up
arrow' and 'down arrow' icons if
necessary
to scroll
through the total display.
On the Zytek engine management system only, each
trouble code definition will be individually selectable to
invoke the clear trouble codes screen. If one or more
trouble codes are selected, the clear all and clear selected
trouble code icons will be displayed.
On all other systems, only the 'Clear All' function is
available.
'Clear All' and 'Clear Selected Codes' Icons
Freeze Frame Data
m*
As any engine management trouble code is
logged,
the system takes a snapshot (freeze
frame) and records the state of all signals at
that time.
On the Zytek engine management system (95 MY), freeze
frame data can be displayed by selecting a logged trouble
code and touching the 'snowflake'
icon.
On the 97 MY EEC V engine management system, freeze
frame data is accessed using the OBD II scan
tool.
ECC-V EMS DTC'S
No fault codes present
l^
D
a
El
The No Fault Codes screen
September 1996 9-53
Page 405 of 421
The Aston Martin Lagonda Diagnostic System
Users Guide
•=2?
Clear all Trouble Codes
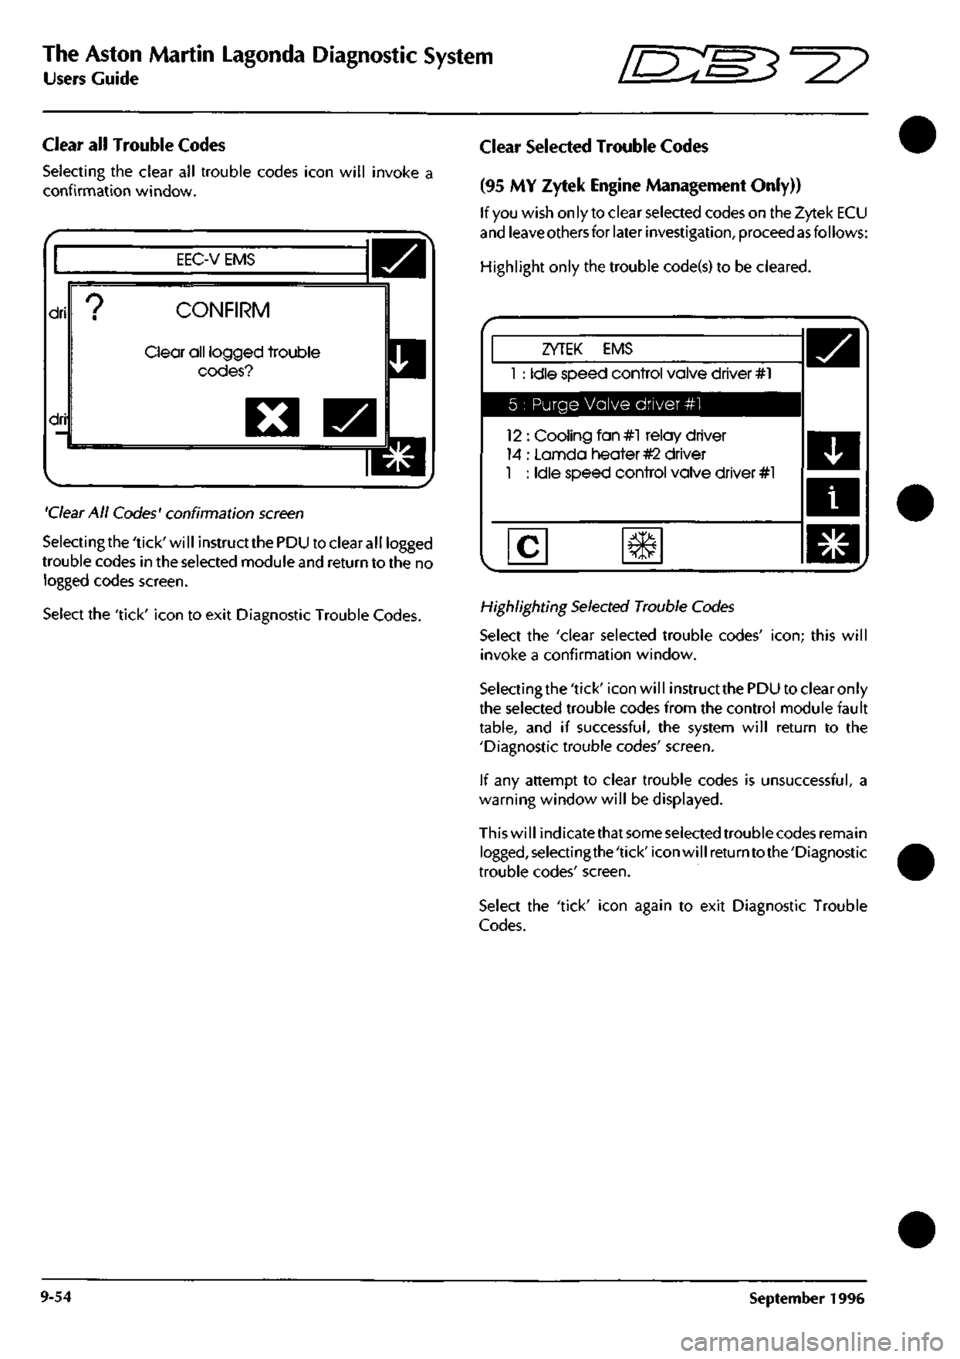
Selecting the clear all trouble codes icon will invoke a
confirmation window.
EEC-V EMS
dri
dri
CONFIRM
Clear all logged trouble
codes?
O
'Clear
All Codes' confirmation
screen
Selectingthe'tick'will instructthePDU to clear all logged
trouble codes in the selected module
and
return to the no
logged codes screen.
Select the 'tick' icon to exit Diagnostic Trouble Codes.
Clear Selected Trouble Codes
(95 MY Zytek Engine Management Only))
If
you
wish only to clear selected codes on the Zytek ECU
and
leave others
for later
investigation,
proceed
as
follows:
Highlight only the trouble code(s) to be cleared.
ZYTEK EMS
1 : Idle speed control valve driver #1
5 : Purge Valve driver #1
12 : Cooling fan#l relay driver
14 : Lannda heater
#2
driver
1 : Idle speed control valve driver #1
Highlighting
Selected
Trouble
Codes
Select the 'clear selected trouble codes'
icon;
this will
invoke a confirmation window.
Selectingthe 'tick' icon will instruct
the
PDU to clear only
the selected trouble codes from the control module fault
table,
and if successful, the system will return to the
'Diagnostic trouble codes' screen.
If any attempt to clear trouble codes is unsuccessful, a
warning window will be displayed.
This will indicatethat
some selected
trouble codes remain
logged,selectingthe'tick'iconwillreturntothe'Diagnostic
trouble codes' screen.
Select the 'tick' icon again to exit Diagnostic Trouble
Codes.
9-54 September 1996
Page 406 of 421
"^I?
The Aston Martin Lagonda Diagnostic System
Users Guide
Datalogger
Introduction
Datalogger is software produced to identify permanent or
intermittent faults on vehicle electronics. The objective of
Datalogger is to provide a view of the vehicle's electrical
behaviour, such that intermittent activity can be recorded
and interpreted quickly and accurately. Running on the
Portable Diagnostic Unit (PDU), the Datalogger
appi ication can captu
re
vehicle information in three ways.
• Serial communications direct from the control unit.
• Parallel communications using the Interface Adaptor.
• Direct signal monitoringusingthemeasurementprobes.
Serial Communication
Serial Communication is a two-wire communication link
between the PDU and most vehicle control modules
providingdigital measurements forconnected components.
The serial communication link allows the tester to
determine the current condition of components connected
to the control module, and to identify any history of faults.
On later vehicles, the PDU is connected to the vehicle
diagnostic sockets via the mu
Iti
Protocol Adaptor (MPA) to
gather serial data from the control modules.
Parallel Communication
The Vehicle Interface Adapter (VIA) provides an interface
between the PDU and the vehicle harnesses for the
acquisition of multiple analogue measurements. The VIA
is
connected between the relevantvehicle control module
and it'sharness connector. Thisallows the PDU to captu re
information from a multitude of channels entering the
control module. This vehicle interface is used with control
modules not equipped with a serial communication link
(Teves Mk II braking system and the air conditioning
system).
Measurement Probes
The measurement probes permit readings to be taken
directly from any connector on the vehicle.
Datalogger Applications
Datalogger may be used to interrogate the following DB7
systems:
• ABS braking system controller
• Engine Management Controller
• Air Conditioning Controller
• Automatic Transmission Controller
• Passive Anti Theft (97 MY)
• Security System (97 MY)
Using the Datalogger
Configure the vehicle to the normal operating conditions
for the system under test.
From the PDU main menu screen:
Highlight 'Diagnostics'.
Press the 'tick' icon to confirm the selection.
Enter the Transmission Type and confirm the selection.
Select the Vehicle Area to be tested and confirm the
selection.
The PDU tools screen should now be displayed.
Highlight 'Datalogger'.
Confirm the selection with the 'tick'
icon.
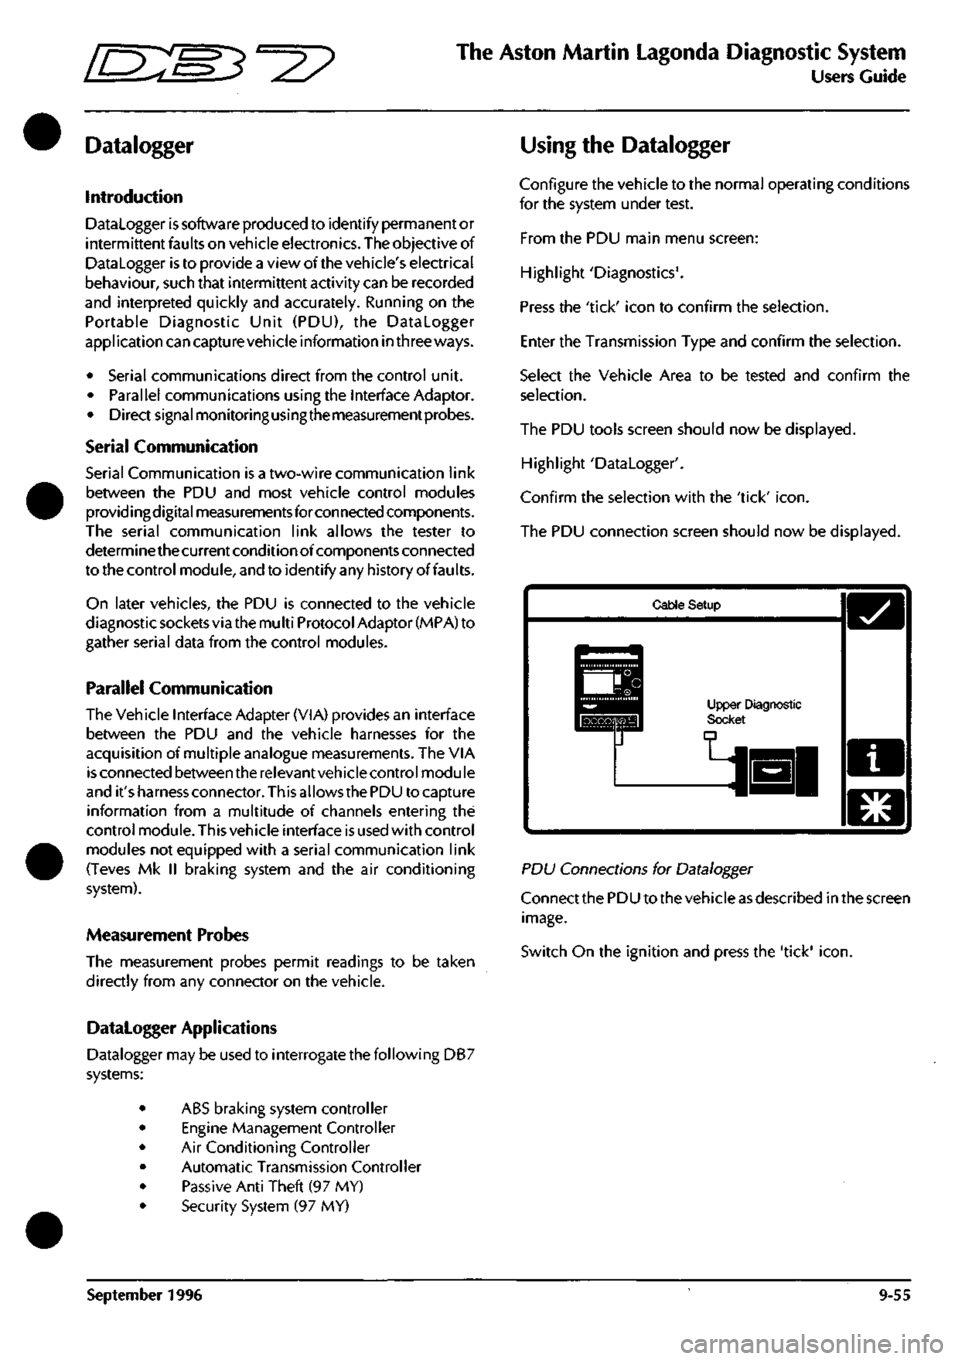
The PDU connection screen should now be displayed.
Cable Setup
Upper Diagnostic Socl
PD\J Connections for Datalogger
Connect the PDU to the vehicle as described in the screen
image.
Switch On the ignition and press the 'tick'
icon.
September 1996 9-55
Page 407 of 421
The Aston Martin Lagonda Diagnostic System
Users Guide •^^
'Establishing connection to control module' should now
be displayed on the screen.
If for any reason the PDU cannot communicate with the
relevantvehiclecontrol modulea 'communicationsfailure
screen'
will be displayed with a retry option.
Check all connections before retrying.
Once commu nications are successfu
I
'Starti ng Datalogger'
will appear on the screen momentarily.
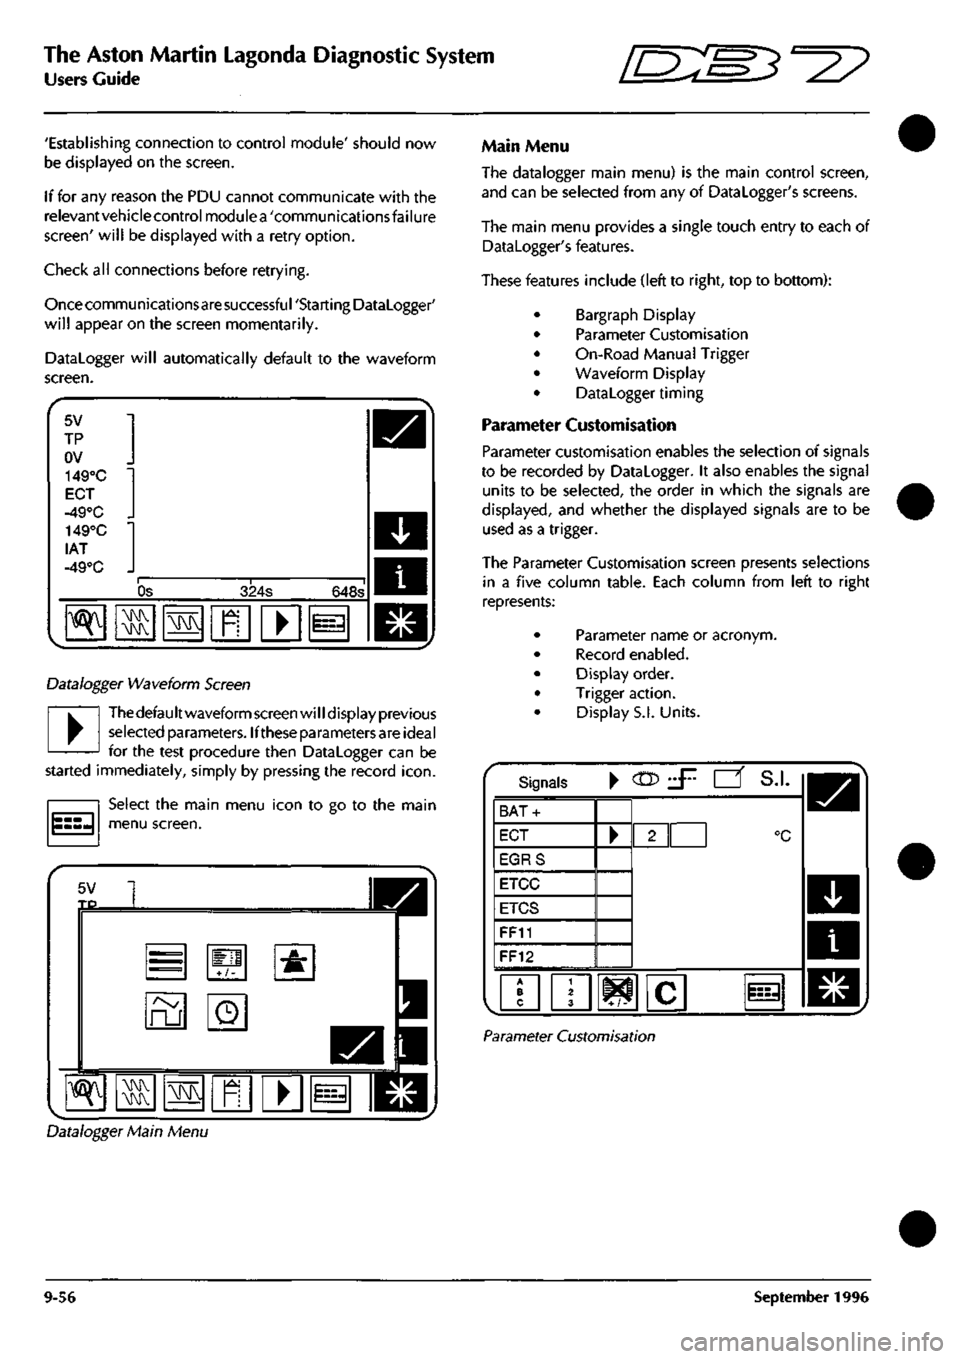
Datalogger will automatically default to the waveform
screen.
5V
TP
ov
149°C
EOT
-49°C _
lAT
-49°C _
"^
Os 324s 648s
•\N
M\^
\!M
n
• i=-i
Datalogger Waveform Screen
•
Thedefaultwaveform screen will display previous
selected parameters. Ifthese parameters are ideal
for the test procedure then Datalogger can be
started immediately, simply by pressing the record
icon.
Select the main menu icon to go to the main
menu screen.
5V TP
=
ru
+/-
o
•&
^ M\K ras
1
I
Main Menu
The datalogger main menu) is the main control screen,
and can be selected from any of Datalogger's screens.
The main menu provides a single touch entry to each of
Datalogger's features.
These features include (left to right, top to bottom):
Bargraph Display
Parameter Customisation
On-Road Manual Trigger
Waveform Display
Datalogger timing
Parameter Customisation
Parameter customisation enables the selection of signals
to be recorded by Datalogger. It also enables the signal
units to be selected, the order in which the signals are
displayed,
and whether the displayed signals are to be
used as a trigger.
The Parameter Customisation screen presents selections
in a five column table. Each column from left to right
represents:
Parameter name or acronym.
Record enabled.
Display order.
Trigger action.
Display S.I. Units.
Signals •
CO?
J^ •' S.I.
BAT-
ECT
EGRS
ETCC
ETCS
FF11
FF12
/•? 103
Parameter Customisation
Datalogger Main Menu
9-56 September 1996
Page 408 of 421
^
The Aston Martin Lagonda Diagnostic System
Users Guide
Parameter Name
Parameters can be fault codes, inputs to, or specific
outputs from, a vehicle control module.
The number of parameters selectable is limited to 32.
If the number of parameters available for customization
exceeds the d isplay
area,
the arrow buttons wi
11
be present,
allowing display area scrolling.
The parameters declared to Datalogger are initially
presented in alphabetical order.
Record Enabled
Record enabled is used to select which signals are to be
recorded.
To select a signal for recording, touch the rectangle next
to the signal name.
The record button will then be displayed.
Nofe:
Additional rectangles may appear in other columns
beside a selected signal name, indicating that the signal
units may be changed or that the signal may be used
as
a
trigger.
It should be noted that the more parameters you select to
record the slower the PDU's sample rate will be for each
parameter e.g. The PDU may be able to monitor six
parameters sampling each parameter twice a second. If
the number of parameters is increased to twelve then the
PDU would only be able to sample each parameter once
per second, thus reducing its ability to capture fast faults;
therefore it
is
recommended that the number of parameters
is kept to a minimum.
Display Order
Parameters may be displayed on the waveform/ bargraph
screen in any order.
To set the parameter display order, press the required
rectangle to create a numbered list.
Note: It
is
not
necessary to
display all of the parameters
required to be recorded.
This has particular benefits if a parameter is to be used as
a trigger but is not required to be displayed.
Trigger Action
For a detailed description of trigger action, refer to the
Trigger Customisation description on the following page.
S.I.
Units
Certain parameters can be measured / displayed in a
number of different units eg temperature in °C or °F. If a
rectangle appears around the displayed units in the
'S.I.'
column then the units are selectable. Each time the
rectangle is pressed, the selectable units scroll one step
through the available options.
Other Features
To make parameter customization easier two icons have
been introduced on to the bottom of the screen, these are:
This icon simply puts all ofthesignals selected for
recording in alphabetical order irrespective of
the language.
A B C
This icon will put all of the signals selected for
recording at the top of the parameter list in
numerical order.
^T/^
After the parameter customization process is completed,
return to the Datalogger main menu.
Default Customisation
To cancel all customisations, press the
Customisation Reset
icon.
This will reset the
customisation on all parameters to the default
setting.
Trigger Customisation
Datalogger operates using a 'rolling memory'.
When the Record icon is selected on the waveform
display, PDU will start to record data, it will then continue
to record data until its memory is
full.
At this point it will continue recording by overriding the
oldest
data.
This process will continue indefinitely or until
the trigger is activated.
When the trigger is activated it performs a number of
functions.
a) The first function istoplaceazerotimepointwithin
the stored data, this enables the trigger point to be
easily accessible in later stages.
b) The second function is to set a timer, ensuring that
the PDU wil
I
only continue recording for the time
selected in 'test-duration'.
September 1996 9-57
Page 409 of 421
The Aston Martin Lagonda Diagnostic System
Users Guide 5^^?
Only the data within the selected time period will be
stored.
A trigger is used to define the zero time point on
any waveform display. This is used to make it easier to
locate the actual point at which the fault occurred on the
waveform display. Triggers may take three forms.
1.
Manual Trigger
A manual trigger would be used in circumstances where
the technician can clearly identify the point when the fault
occurs and has access to the PDU at this point.
The trigger icon should be pressed on the waveform /
bargraph display (ortheon-road trigger icon) at the instant
the fault occurs. This will then become the zero point for
the waveform/bargraph display. The waveform/bargraph
display up to this point would have a negative form.
2.
Fault Code Trigger
The fault code trigger is used when the first indication of
a fault is normally by the appearance of a warning lamp
within the instrument pack. For some vehicle systems
Datalogger can trigger on specific fault codes, this type of
triggering is more precise than simply triggering on the
warning lamp.
This trigger
is
selected during the parameter customisation
process. To select a fault code to trigger 'on', set the fault
code (parameter) to record.
Asign the display order by touching the rectangle below
the Eye icon repeatedly until the desired display order
number is shown.
Press the rectangle in the trigger column.
Highlight the fault code parameter again and select the
magnifying glass
icon.
The trigger customisation screen
will be displayed.
Select the appropriate trigger style icon and select the tick
icon to confirm.
Press the Tick icon again to return to the main Datalogger
screen.
Select the Record icon to start data capture.
The unit will trigger when the fault code appears and will
set the zero time point of the waveform / bargraph display.
3. Specific Signal Trigger
It is possible to select a specific parameter or signal to
trigger Datalogger.
Triggering on specific signals is likely to be used when the
vehicle system has no on-board diagnostics or when
diagnostic information is not readily available at the time
the fault occurs, e.g. air-conditioning.
Thistypeoftriggershouldonly be used when it is known
that a particular signal has certain characteristics at the
time the fault occurs, e.g. one signal will always go from
12 Volts to ground, bringing on a warning lamp when a
particular fault occurs,
as
this is a known event, this signal
may be used to trigger the PDU.
Trigger Selection
Any of the record enabled parameters may be used to
trigger Datalogger.
To select a trigger highlight the parameter name, a
magnifying glass type icon will appear at the bottom of the
screen.
Select the magnifying glass type
icon.
The trigger action screen should be displayed.
ABSWl
Trigger
-T-
Anti-lock Brak
^
^M
ov
es Warning
L
zF
!
=^
S.I.
°C
Ei
.amp
i
m,
Trigger Action Screen
9-58 September 1996
Page 410 of 421
^^?
The Aston Martin Lagonda Diagnostic System
Users Guide
The following trigger options are available:
Triggers when the signal passes above
a
specified
value,
i.e. stop lamp.
Triggers when the signal passes below
a
specified
value,
i.e. Anti-Lock brakes warning lamp.
Triggers when the signa
I
passes outside
a
specified
band,
i.e. oxygen sensor feedback.
Triggers when the signal passes into a specified
band.
Once the type of trigger has been selected the trigger
vaiue(s) (i.e. the signal level at which the trigger point wil
I
occur) should be set.
These values are set by highlighting the existing value.
i
ECT ^ 1
Trigger KBIT" ^
^^^^1
S.I.
°c
Oj
Engine coolant temperature
m
^
Highlighted Trigger Value
Press the calculator-style
icon.
A new screen should now be displayed.
Trigger Value Entry
Enter the required trigger value using the calculator-style
screen buttons.
The S.I. button enables unit selection, where applicable,
refer to S.I. Units.
Confirm the trigger value by pressing the 'tick'
icon.
The trigger screen will now be re-displayed.
Press the 'tick' icon to go back to the Parameter
Customisation screen.
Press the 'tick' icon again to return to the datalogger main
menu.
September 1996 9-59
Page 411 of 421
The Aston Martin Lagonda Diagnostic System
Users Guide ^?
Datalogger Timing
Select the 'clock' icon from the main menu screen.
Confirm the selection using the 'tick'
icon.
The Datalogger timing screen should now be displayed.
Datalogger Timing
Signals
Sample Interval
Record time
Pre-trigger
Post-trigger
00:33:20
50%
00:16:40
50%
00:16:40
'^
23]
Datalogger Timing
The Datalogger timing screen allows customisation of the
sample interval and duration of data capture.
The display will identify the number of parameters
(channels) which have been selected to be recorded by
Datalogger.
Timing changes can only be made while data capture is
inactive. Entering Dataloggertiming while vehicle data is
being captured will display the current
settings,
but disable
selection.
Signals
The signals are the number of parameters set for sampIing
by Datalogger.
Sample Interval
The sample interval (frequency) defines the time interval
between successive block requests for all recorded
parameters.
The sample interval is selectable to enable fast response to
intermittent faults.
Note: Very short sample intervals may reduce test
duration
because ttie
PDU memory
becomes
full of
data.
Select the sample interval rectangle.
Acaiculator-style icon should nowbedisplayed. rrr?]
^
Aswellasa calculator-style icon beingdisplayed
there will bea hare
icon,
selecting this icon will
automatically set the fastest sample rate for the
selected parameters.
Note: The fastest sannple rate set using the 'hare' icon may
be too fast for some applications.
Select the calculator-style
icon.
A new screen should now be displayed.
Enter Test Duration
IDD 33 EDI
CL m m [Z]
Ci] ra [I]
1
1 2 1 3 1
0
1
Test Duration
Enter the required value in milliseconds up toa maximum
of 60,000 mS (1 min). At this stage Datalogger will not
verify if the entered sample interval can be achieved.
When Datalogger is actioned to start recording vehicle
data,
and the sample interval is shorter than the fastest
achievable capture time, a warning screen will be
displayed,
requesting changes to the sample interval.
Record Time
The record time (test duration) defines the length of the
data slice which will be preserved for analysis after the
fault occurs. The selected time will be split equally before
and after the fault trigger, e.g. a 10 minutes recording will
preserve data from 5 minutes before to 5 minutes after the
fault.
At the end of the record time the PDU will automatically
stop recording.
The record time is entered in the same way as the sample
interval,
by enabling the rectangle and selecting the
calculator-style
icon.
9-60 September 1996
Page 412 of 421
•
^m:E3^^?
The Aston Martin Lagonda Diagnostic System
Users Guide
Pre-trigger and Post-trigger
The pre-trigger and post-trigger represent the duration of
the tests before and after the trigger point respectively.
Waveform
Select the waveform icon from the main menu, confirm
selection usingthe'tick'icon;thewaveform screen should
now be displayed.
System Icons
For
a
detai led description of each of the system icons, refer
to the on-screen Dataslogger Training Programme.
Datalogger Specific Icons
The Datalogger specific icons are those at the bottom of
the screen.
5V
TP
OV
149 "C
ECT
-49°C .
149°C •
lAT
-49°C .
_r
1
^Jh
r
Os 324s 648s
^
\N
• 1=3
Wa\/eiorm Display
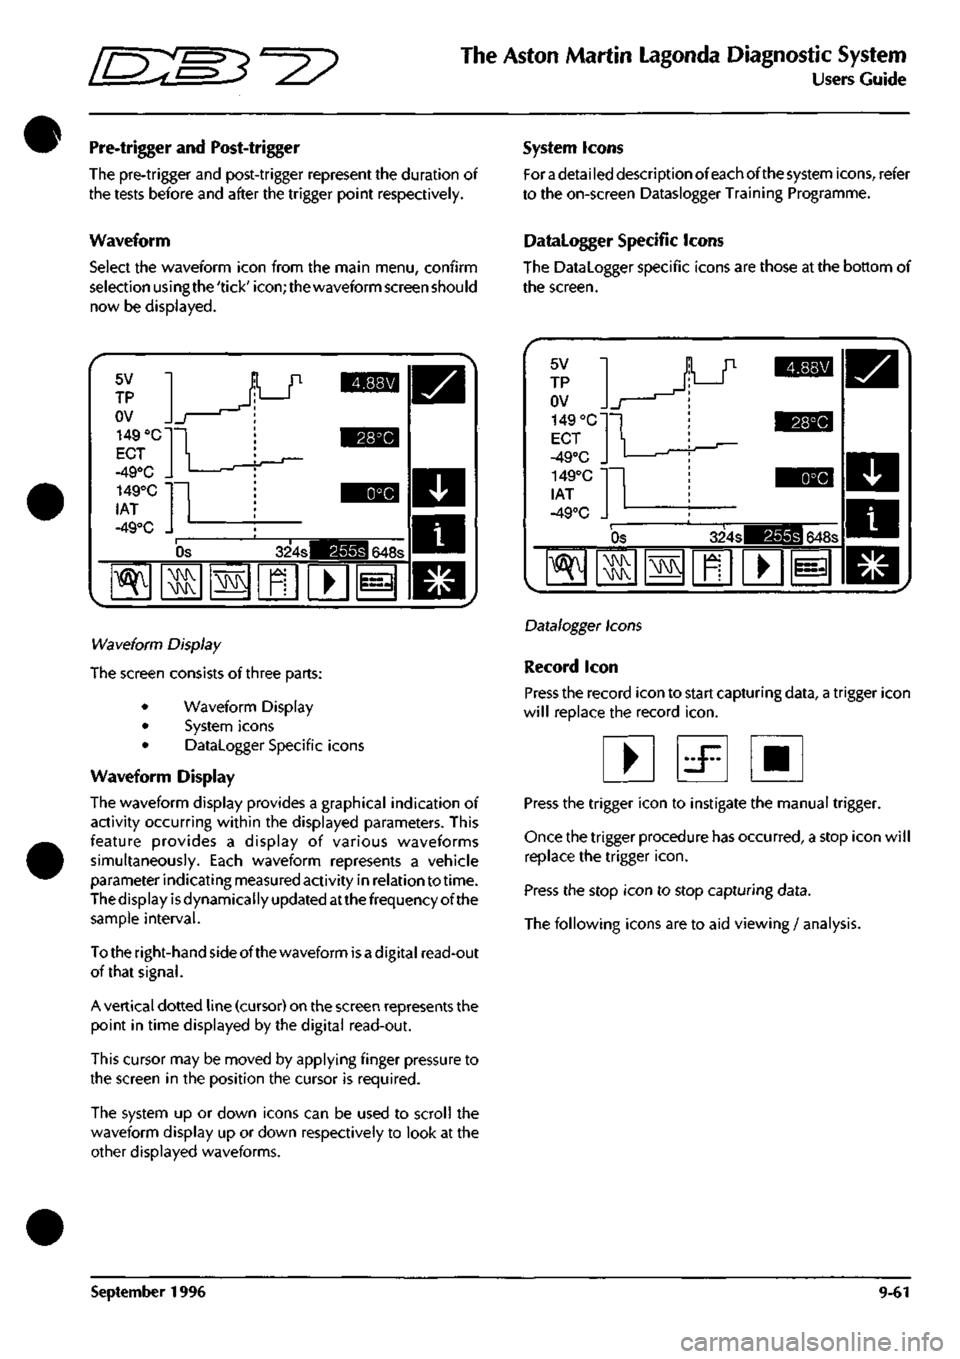
The screen consists of three parts:
• Waveform Display
• System icons
• Datalogger Specific icons
Waveform Display
The waveform display provides a graphical indication of
activity occurring within the displayed parameters. This
feature provides a display of various waveforms
simultaneously. Each waveform represents a vehicle
parameterindicatingmeasuredactivity in relation to time.
The display is dynamically updated atthe frequency of the
sample interval.
Totheright-handsideofthewaveform isadigital read-out
of that signal.
A vertical dotted line (cursor) on the screen represents the
point in time displayed by the digital read-out.
This cursor may be moved by applying finger pressure to
the screen in the position the cursor is required.
The system up or down icons can be used to scroll the
waveform display up or down respectively to look at the
other displayed waveforms.
5V
TP
OV
149 °C'
ECT
-49°C ,
149°C
lAT
-49°C . 1
Os 324s 648s
"^
MMV MMV
MMV
1^
•
Datalogger Icons
Record icon
Press the record icon to start capturing data, a trigger icon
will replace the record
icon.
• d^ •
Press the trigger icon to instigate the manual trigger.
Once the trigger procedure has occurred, a stop icon will
replace the trigger
icon.
Press the stop icon to stop capturing data.
The following icons are to aid viewing / analysis.
September 1996 9-61
Page 413 of 421
The Aston Martin Lagonda Diagnostic System
Users Guide ^2?
Split Cursor Icon
The split cursor icon spl its the vertical cursor into
two parts.
1^
VV
One permanent static cursor represented by
a
solid vertical
line in the waveform display, and one moveable cursor
represented by a dotted vertical line, this is moved by
applying finger pressure to the screen in the position the
cursor is required.
The digital display of the waveforms will now represent
the difference in levels between the two cursors and not
the absolute signal level as detailed earlier.
Re-scale Vertical Icon
Normally all of the waveforms are displayed
with the vertical axis representing the maximum
possible variation ofthesignal,
e.g.
battery voltage
0 to 16 V.
The re-scale icon causes the waveform to scale such that
the recorded variation determines the scale, this normally
enlarges the vertical scale.
The scaling operation can be performed on any of the
displayed waveforms by highlighting the parameter name
prior to the operation.
Once auto-scaling
has
taken place, further manual scaling
may be achieved by using the '+' and '-' system icons.
Waveform Display Number
This icon enables control of the number of
waveforms displayed on the screen at any one
MMV
MMV
time.
Pressing this icon causes the '+' and '-' system icons to
appear. Using these system icons increase or decrease the
number of displayed waveforms.
It should be noted that the more waveforms displayed the
poorer the detail becomes, therefore the number of
displayed waveforms should be kept to a minimum.
Horizontal Scale
-^ This icon performs the same function as the re-
scale vertical icon only for the horizontal axis.
By expanding the scale more detail will be available, thus
proving easier to analyse. However the amount of time
displayed on any one screen will be reduced.
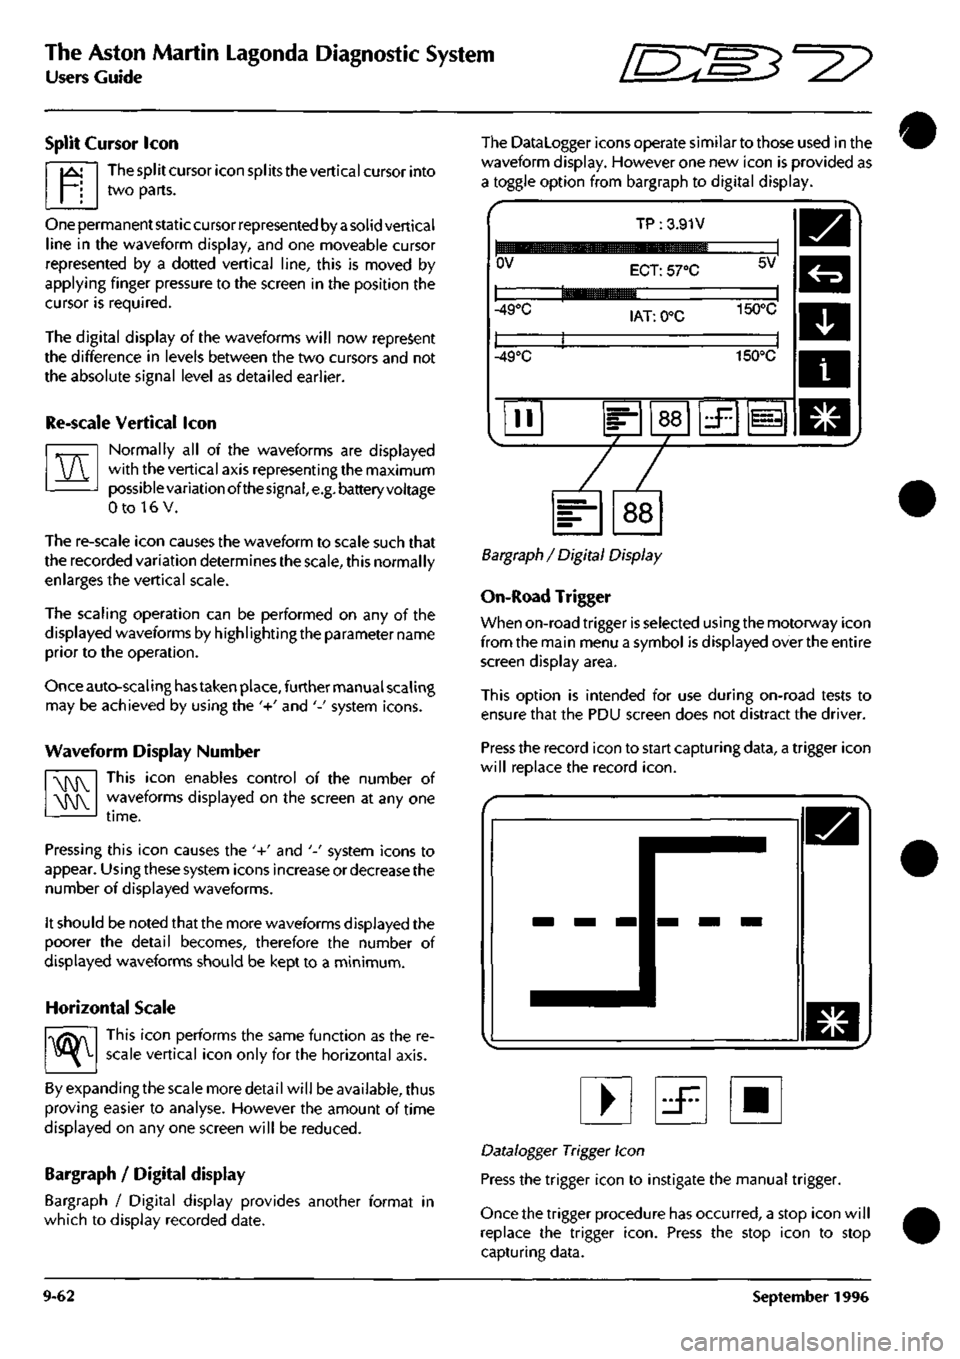
Bargraph / Digital display
Bargraph / Digital display provides another format in
which to display recorded date.
The Datalogger icons operate similar to those used in the
waveform display. However one new icon is provided as
a toggle option from bargraph to digital display.
OV
TP :3.91V
ECT: 57°C 5V
-49°C lAT: 0°C 150°C
-49°C 150°C
II 88 zF 1^
Bargraph / Digital Display
On-Road Trigger
When on-road trigger is selected using the motorway icon
from the main menu a symbol is displayed over the entire
screen display area.
This option is intended for use during on-road tests to
ensure that the PDU screen does not distract the driver.
Press the record icon to start capturing data, a trigger icon
will replace the record
icon.
• iF •
Datalogger Trigger Icon
Press the trigger icon to instigate the manual trigger.
Once the trigger procedure has occurred, a stop icon will
replace the trigger
icon.
Press the stop icon to stop
capturing data.
9-62 September 1996