MERCEDES-BENZ C-Class 2015 W205 Comand Manual
Manufacturer: MERCEDES-BENZ, Model Year: 2015, Model line: C-Class, Model: MERCEDES-BENZ C-Class 2015 W205Pages: 214, PDF Size: 5.16 MB
Page 211 of 214

Sample displays of weather data in the
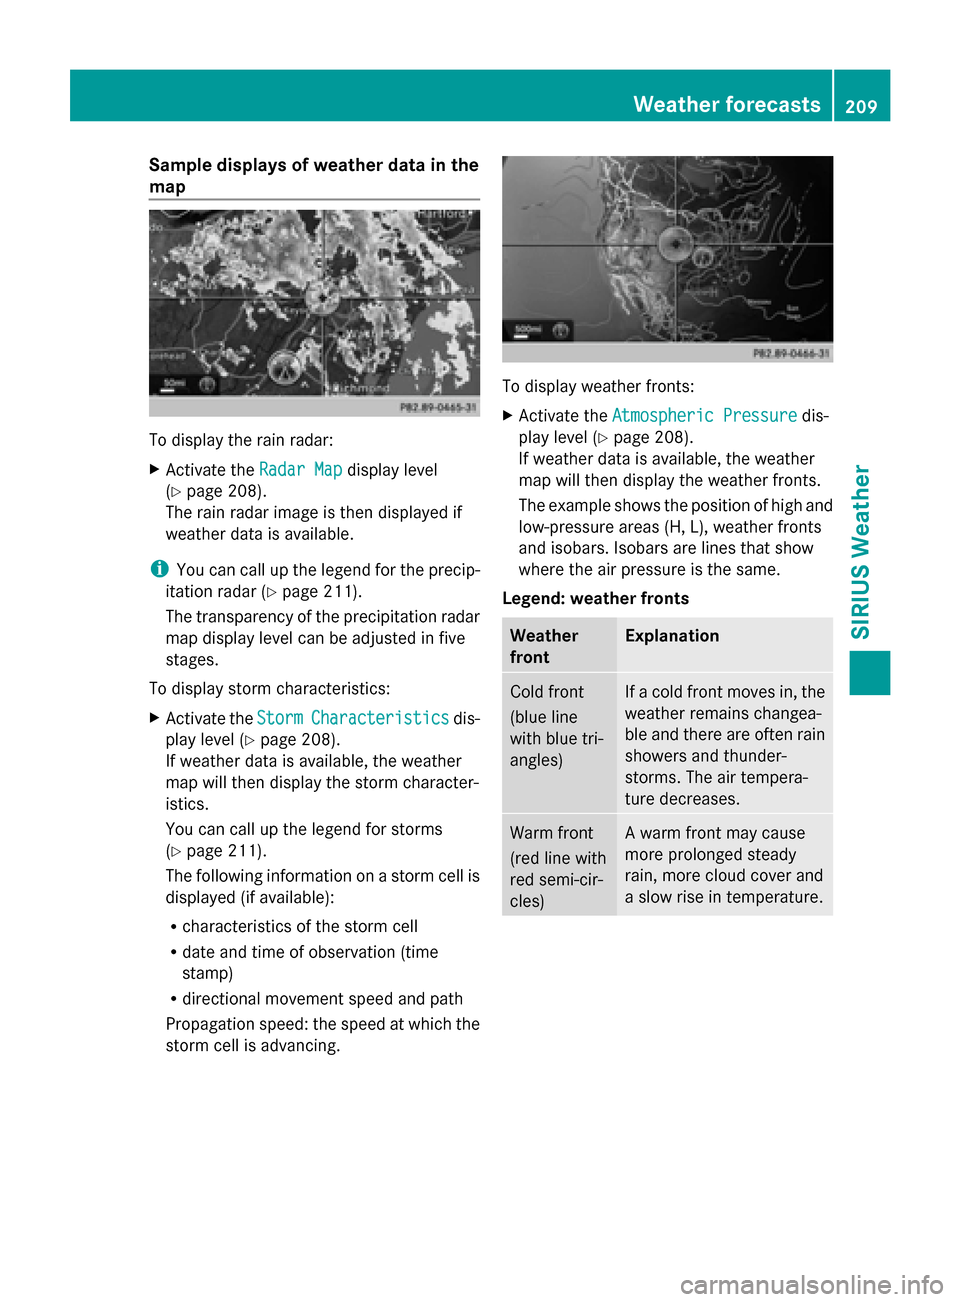
map To display the rain radar:
X
Activate the Radar Map Radar Mapdisplay level
(Y page 208).
The rain radar image is then displayed if
weather data is available.
i You can call up the legend for the precip-
itation radar (Y page 211).
The transparency of the precipitation radar
map display level can be adjusted in five
stages.
To display storm characteristics:
X Activate the Storm
Storm Characteristics Characteristics dis-
play level (Y page 208).
If weather data is available, the weather
map will then display the storm character-
istics.
You can call up the legend for storms
(Y page 211).
The following information on a storm cell is
displayed (if available):
R characteristics of the storm cell
R date and time of observation (time
stamp)
R directional movement speed and path
Propagation speed: the speed at which the
storm cell is advancing. To display weather fronts:
X
Activate the Atmospheric Pressure Atmospheric Pressure dis-
play level (Y page 208).
If weather data is available, the weather
map will then display the weather fronts.
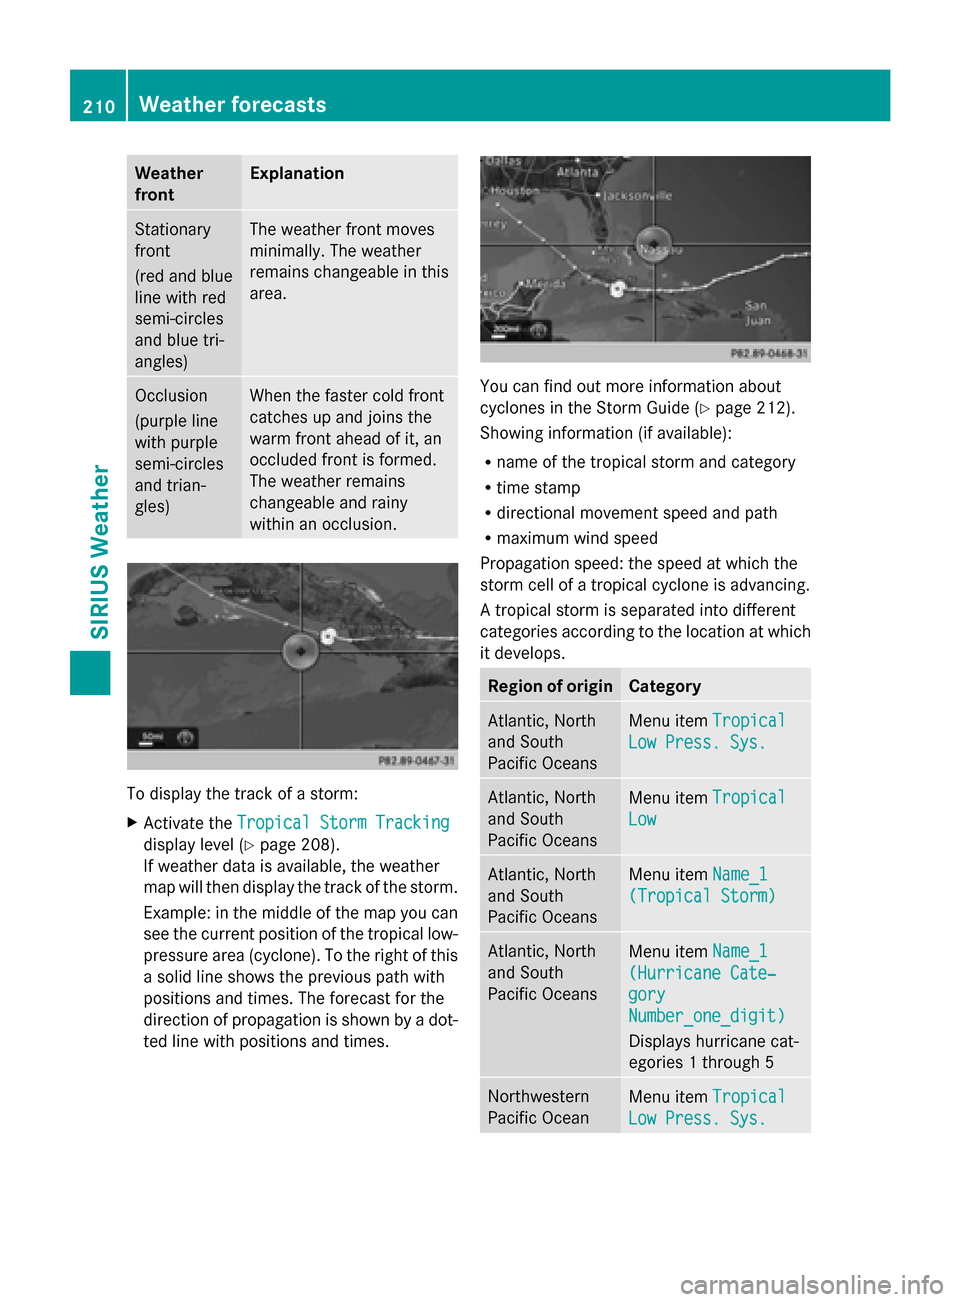
The example shows the position of high and
low-pressure areas (H, L), weather fronts
and isobars. Isobars are lines that show
where the air pressure is the same.
Legend: weather fronts Weather
front Explanation
Cold front
(blue line
with blue tri-
angles) If a cold front moves in, the
weather remains changea-
ble and there are often rain
showers and thunder-
storms. The air tempera-
ture decreases.
Warm front
(red line with
red semi-cir-
cles) A warm front may cause
more prolonged steady
rain, more cloud cover and
a slow rise in temperature. Weather forecasts
209SIRIUS Weather
Page 212 of 214

Weather
front Explanation
Stationary
front
(red and blue
line with red
semi-circles
and blue tri-
angles) The weather front moves
minimally. The weather
remains changeable in this
area.
Occlusion
(purple line
with purple
semi-circles
and trian-
gles) When the faster cold front
catches up and joins the
warm front ahead of it, an
occluded front is formed.
The weather remains
changeable and rainy
within an occlusion.
To display the track of a storm:
X
Activate the Tropical Storm Tracking Tropical Storm Tracking
display level (Y page 208).
If weather data is available, the weather
map will then display the track of the storm.
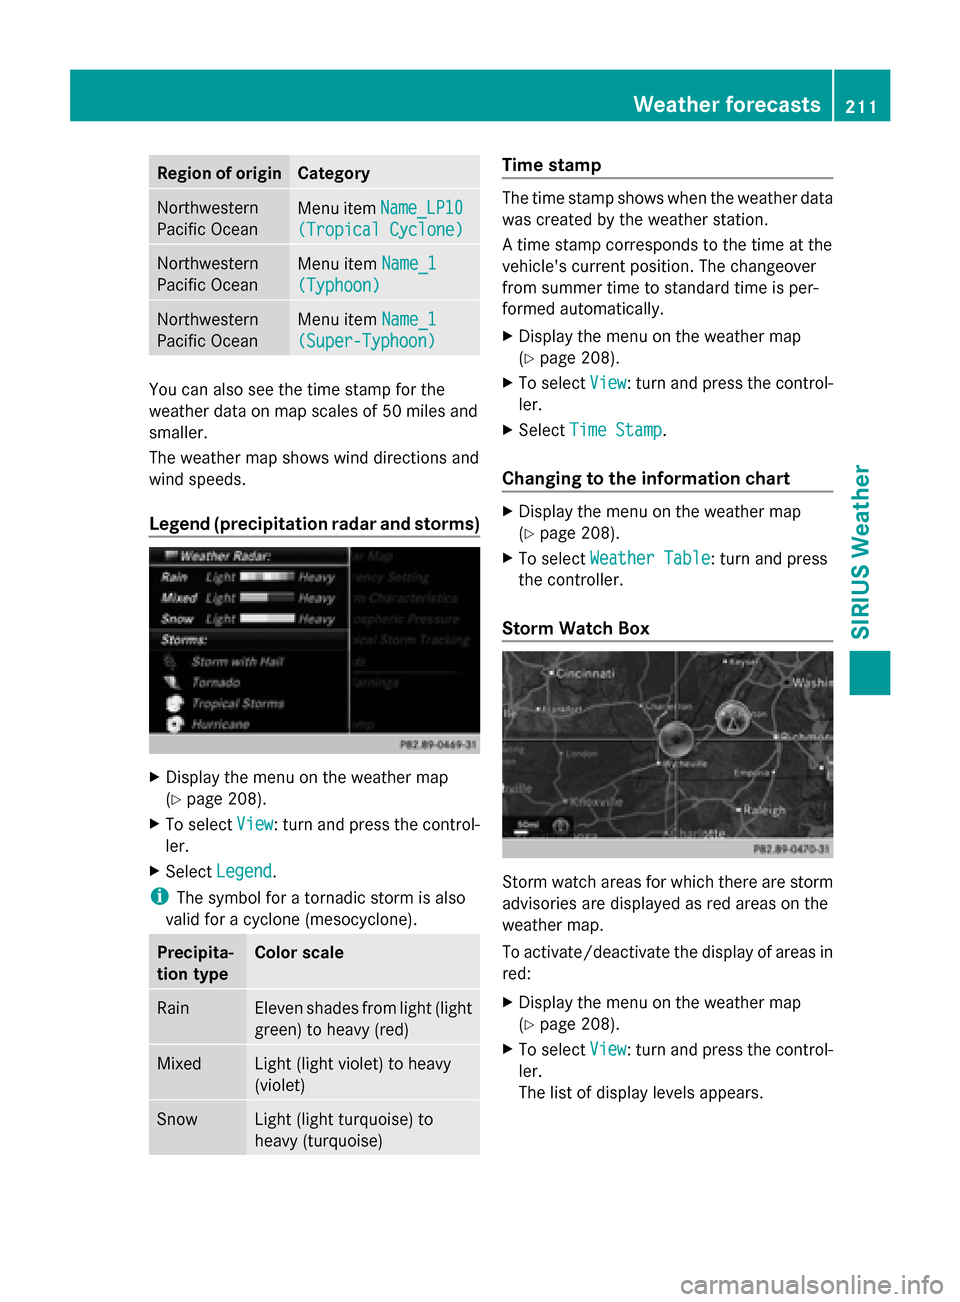
Example: in the middle of the map you can
see the current position of the tropical low-
pressure area (cyclone). To the right of this
a solid line shows the previous path with
positions and times. The forecast for the
direction of propagation is shown by a dot-
ted line with positions and times. You can find out more information about
cyclones in the Storm Guide (Y
page 212).
Showing information (if available):
R name of the tropical storm and category
R time stamp
R directional movement speed and path
R maximum wind speed
Propagation speed: the speed at which the
storm cell of a tropical cyclone is advancing.
A tropical storm is separated into different
categories according to the location at which
it develops. Region of origin Category
Atlantic, North
and South
Pacific Oceans
Menu item
Tropical Tropical
Low Press. Sys.
Low Press. Sys. Atlantic, North
and South
Pacific Oceans
Menu item
Tropical Tropical
Low
Low Atlantic, North
and South
Pacific Oceans
Menu item
Name_1 Name_1
(Tropical Storm)
(Tropical Storm) Atlantic, North
and South
Pacific Oceans
Menu item
Name_1 Name_1
(Hurricane Cate‐
(Hurricane Cate‐
gory gory
Number_one_digit) Number_one_digit)
Displays hurricane cat-
egories 1 through 5 Northwestern
Pacific Ocean
Menu item
Tropical Tropical
Low Press. Sys.
Low Press. Sys. 210
Weather forecastsSIRIUS Weather
Page 213 of 214

Region of origin Category
Northwestern
Pacific Ocean
Menu item
Name_LP10 Name_LP10
(Tropical Cyclone)
(Tropical Cyclone) Northwestern
Pacific Ocean
Menu item
Name_1
Name_1
(Typhoon) (Typhoon) Northwestern
Pacific Ocean
Menu item
Name_1
Name_1
(Super-Typhoon) (Super-Typhoon) You can also see the time stamp for the
weather data on map scales of 50 miles and
smaller.
The weather map shows wind directions and
wind speeds.
Legend (precipitation radar and storms) X
Display the menu on the weather map
(Y page 208).
X To select View
View : turn and press the control-
ler.
X Select Legend
Legend.
i The symbol for a tornadic storm is also
valid for a cyclone (mesocyclone). Precipita-
tion type Color scale
Rain Eleven shades from light (light
green) to heavy (red)
Mixed Light (light violet) to heavy
(violet)
Snow Light (light turquoise) to
heavy (turquoise) Time stamp
The time stamp shows when the weather data
was created by the weather station.
A time stamp corresponds to the time at the
vehicle's current position. The changeover
from summer time to standard time is per-
formed automatically.
X
Display the menu on the weather map
(Y page 208).
X To select View View: turn and press the control-
ler.
X Select Time Stamp
Time Stamp.
Changing to the information chart X
Display the menu on the weather map
(Y page 208).
X To select Weather Table Weather Table: turn and press
the controller.
Storm Watch Box Storm watch areas for which there are storm
advisories are displayed as red areas on the
weather map.
To activate/deactivate the display of areas in
red:
X
Display the menu on the weather map
(Y page 208).
X To select View View: turn and press the control-
ler.
The list of display levels appears. Weather forecasts
211SIRIUS Weather
Page 214 of 214

X
Select Severe Weather Warnings
Severe Weather Warnings.
X Select Show
Show Symbols
Symbols for
forStorm
Storm Areas
Areas
On Map
On Map .
Depending on the previous setting, activate
0073 or deactivate 0053the display of areas in
red.
To activate/deactivate the automatic display
of warning popups:
X Select Show Automatic Storm Watch
Show Automatic Storm Watch
Popups
Popups .
Depending on the previous setting, activate
0073 or deactivate 0053the automatic display
of warning popups.
To set the radius for the popups:
X Select 5 miles
5 miles (5 km5 km), 50 miles 50 miles (50 km50 km)
or 200 miles
200 miles (200 km200 km).
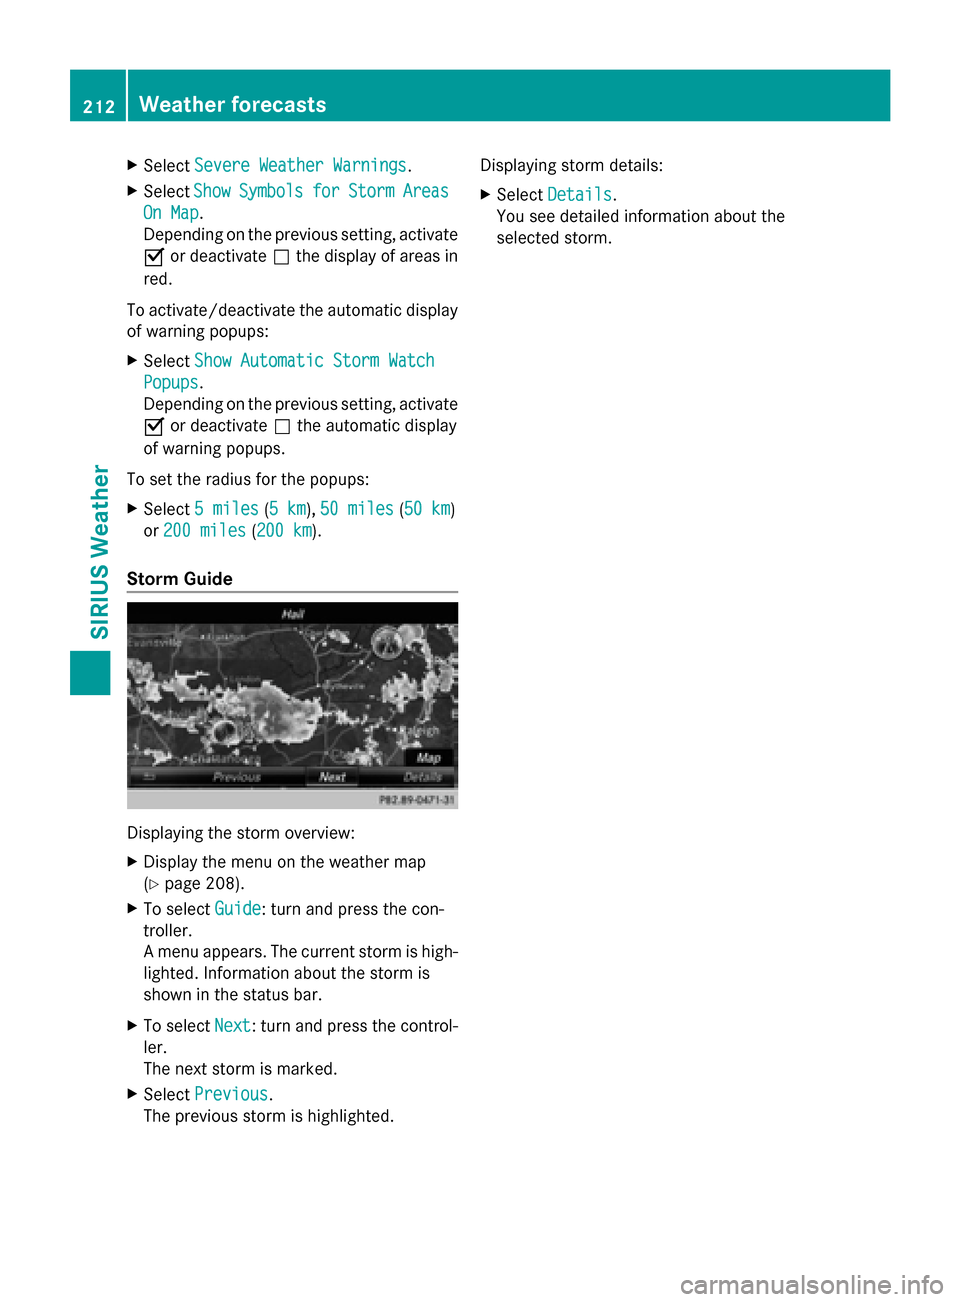
Storm Guide Displaying the storm overview:
X
Display the menu on the weather map
(Y page 208).
X To select Guide
Guide: turn and press the con-
troller.
A menu appears. The current storm is high-
lighted. Information about the storm is
shown in the status bar.
X To select Next
Next: turn and press the control-
ler.
The next storm is marked.
X Select Previous
Previous.
The previous storm is highlighted. Displaying storm details:
X
Select Details Details.
You see detailed information about the
selected storm. 212
Weather forecastsSIRIUS Weather