light ASTON MARTIN DB7 1997 Repair Manual
[x] Cancel search | Manufacturer: ASTON MARTIN, Model Year: 1997, Model line: DB7, Model: ASTON MARTIN DB7 1997Pages: 421, PDF Size: 9.31 MB
Page 384 of 421
^27
The Aston Martin Lagonda Diagnostic System
Users Guide
Engine Diagnostics - 97 MY
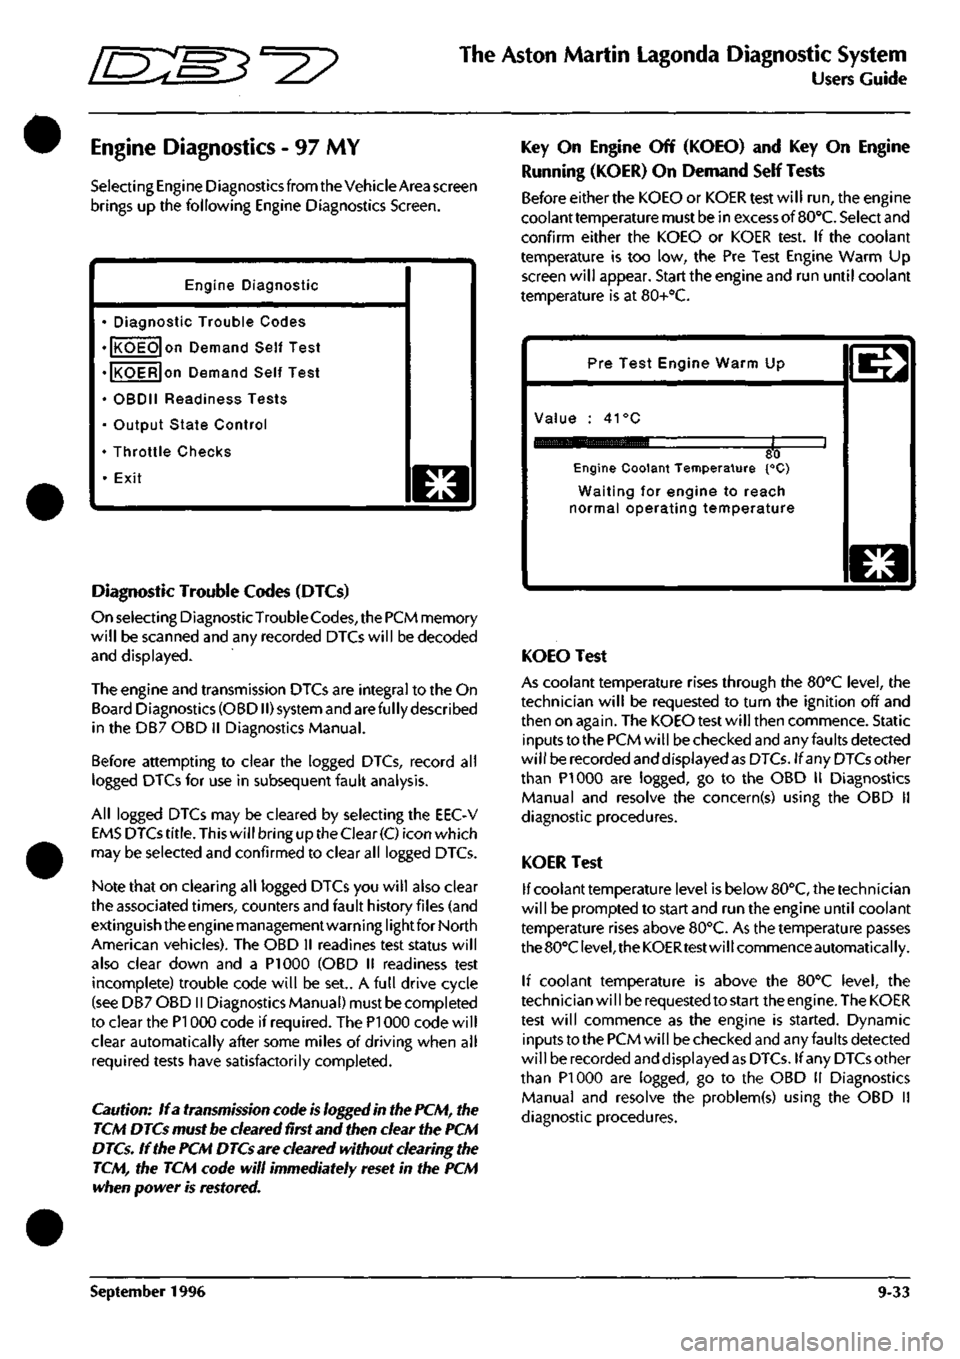
Selecting Engine Diagnostics from the Vehicle Area screen
brings up the following Engine Diagnostics Screen.
Engine Diagnostic
• Diagnostic Trouble Codes
• KOEO on Demand Self Test
• KOER on Demand Self Test
• OBDII Readiness Tests
• Output State Control
• Throttle Checks
• Exit
o
Diagnostic Trouble Codes (DTCs)
On selecting DiagnosticTrouble
Codes,
the PCM memory
will be scanned and any recorded DTCs will be decoded
and displayed.
The engine and transmission DTCs are integral to the On
Board Diagnostics (OBDII) system and are ful ly described
in the DB7 OBD II Diagnostics Manual.
Before attempting to clear the logged DTCs, record all
logged DTCs for use in subsequent fault analysis.
All logged DTCs may be cleared by selecting the EEC-V
EMS DTCs
title.
This will bring up the Clear
(C)
icon which
may be selected and confirmed to clear all logged DTCs.
Note that on clearing all logged DTCs you will also clear
the associated timers, counters and fault history files (and
extinguish the engine management warning lightfor North
American vehicles). The OBD II readines test status will
also clear down and a PI 000 (OBD II readiness test
incomplete) trouble code will be set.. A full drive cycle
(see DB7 OBD II Diagnostics Manual) must be completed
to clear the PI 000 code if required. The PI 000 code will
clear automatically after some miles of driving when all
required tests have satisfactorily completed.
Caution: If a transmission code is logged in the PCM, the
TCM DTCs must be cleared first and then clear the PCM
DTCs. If the PCM DTCs are cleared without clearing the
TCM, the TCM code will immediately reset in the PCM
when power is restored.
Key On Engine Off (KOEO) and Key On Engine
Running (KOER) On Demand Self Tests
Before either the KOEO or KOER test will run, the engine
coolant temperature must be in excess of
BO'C.
Select and
confirm either the KOEO or KOER test. If the coolant
temperature is too low, the Pre Test Engine Warm Up
screen will appear. Start the engine and run until coolant
temperature is at 80+°C.
Pre Test Engine Warm Up
Value : 41°C
80 Engine Coolant Temperature {°C)
Waiting for engine to reach
normal operating temperature
o
KOEO Test
As coolant temperature rises through the BO'C level, the
technician will be requested to turn the ignition off and
then on again. The KOEO test will then commence. Static
inputs to the PCM will be checked and any faults detected
will be recorded and displayed as DTCs. If any DTCs other
than PI 000 are logged, go to the OBD II Diagnostics
Manual and resolve the concern(s) using the OBD 11
diagnostic procedures.
KOER Test
If coolant temperature level is below 80°C, the technician
will be prompted to start and run the engine until coolant
temperature rises above 80°C. As the temperature passes
the 80°C
level,
the KOERtest will commence automatically.
If coolant temperature is above the 80°C level, the
technician wi
11
be requested to start the engine. The KOER
test will commence as the engine is started. Dynamic
inputs to the PCM will be checked and any faults detected
will be recorded and displayed as DTCs. If any DTCs other
than PI 000 are logged, go to the OBD 11 Diagnostics
Manual and resolve the problem(s) using the OBD II
diagnostic procedures.
September 1996 9-33
Page 403 of 421
The Aston Martin Lagonda Diagnostic System
Users Guide [S:S3^2?
The PDU will then check the cable connections. Until all
connections are correct, the PDU will not allow progression
beyond this
screen.
Pressingthe'asterisk'icon and selecting
abort returns the operator to the general screen if an
incorrect system has been chosen.
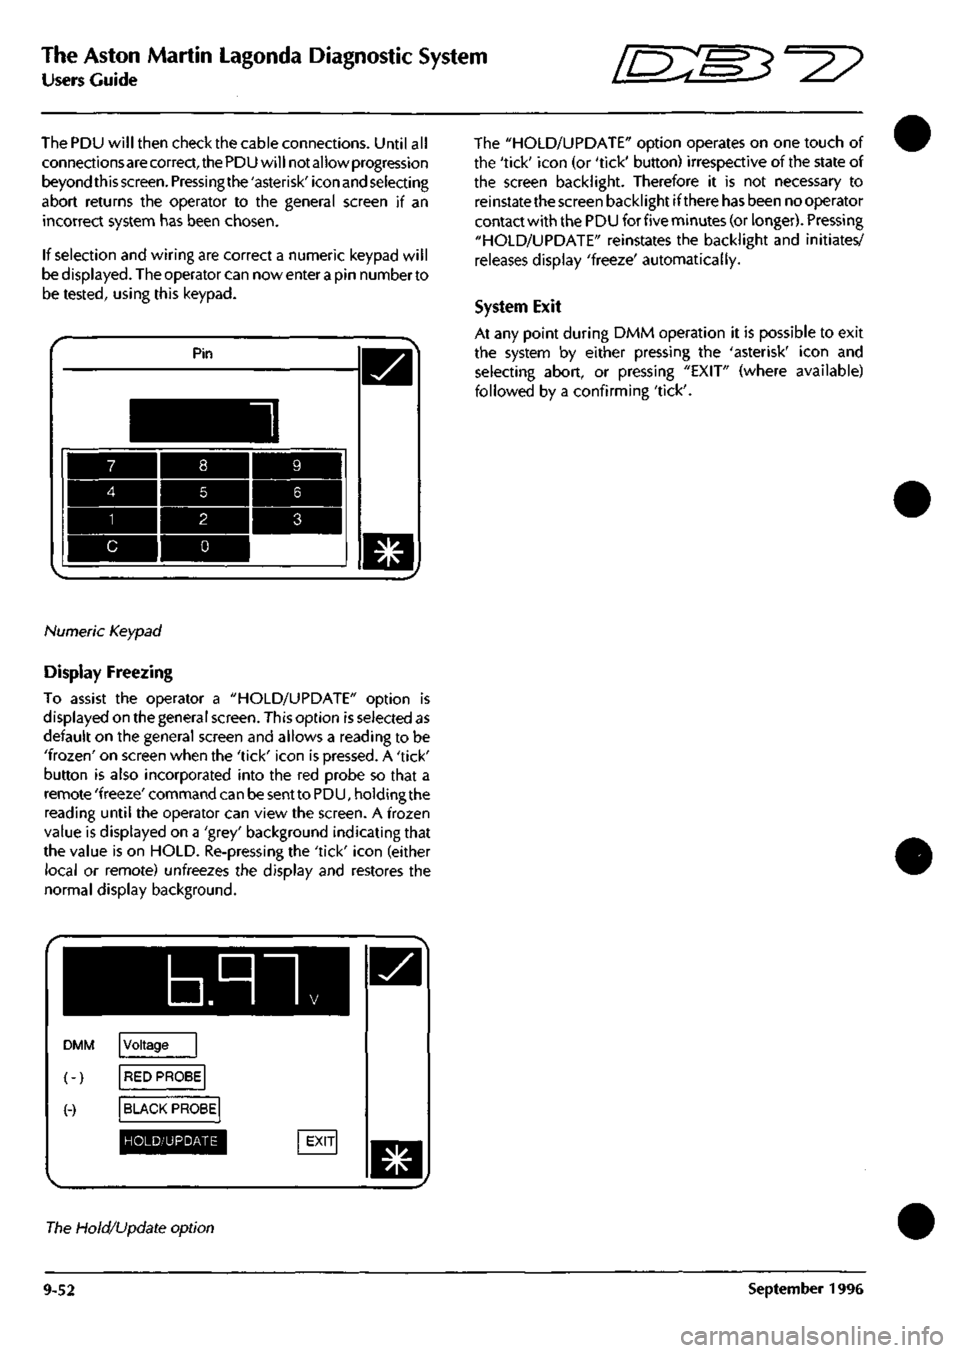
If selection and wiring are correct a numeric keypad will
be displayed. The operator can nowenterapin numberto
be tested, using this keypad.
Pin
Numeric Keypad
Display Freezing
To assist the operator a "HOLD/UPDATE" option is
displayed on the general screen. This option is selected as
default on the general screen and allows a reading to be
'frozen'
on screen when the 'tick' icon is pressed. A 'tick'
button is also incorporated into the red probe so that a
remote 'freeze' command can be sent to PDU, holding the
reading until the operator can view the screen. A frozen
value is displayed on a 'grey' background indicating that
the value is on HOLD. Re-pressing the 'tick' icon (either
local or remote) unfreezes the display and restores the
normal display background.
b.nn
DMM
(-)
(-)
Voltage
RED PROBE
BLACK PROBE
HOLD/UPDATE
The "HOLD/UPDATE" option operates on one touch of
the 'tick' icon (or 'tick' button) irrespective of the state of
the screen backlight. Therefore it is not necessary to
reinstate the screen backlight if there has been no operator
contact with the PDU for five minutes (or longer). Pressing
"HOLD/UPDATE" reinstates the backlight and initiates/
releases display 'freeze' automatically.
System Exit
At any point during DMM operation it is possible to exit
the system by either pressing the 'asterisk' icon and
selecting abort, or pressing "EXIT" (where available)
followed by a confirming 'tick'.
The Hold/Update option
9-52 September 1996
Page 404 of 421
^7
The Aston Martin Lagonda Diagnostic System
Users Guide
Diagnostic Trouble Codes
Introduction
The 'Diagnostic trouble codes' application enables the
PDU to monitor the trouble codes logged in selected
control module's and provides the following functions:
• Decode and display any trouble codes logged by
the control module(s) being monitored.
• Decode and display enhanced diagnostic
information, together with any count of the number
of occurrences, when supported by the control
module(s).
• Clearsomeorallofallthesetroublecodes selected
by the user on the PDU screen, when supported by
the control module(s).
Diagnostic Trouble Codes are logged by the Engine
Management and by the Automatic Transmission control
units and can be accessed using the PDU. Logged codes
in the 95 MY Teves Mk II ABS controller can only be
accessed using the brake warning light. The Air
Conditioning control unit does not log trouble codes.
Operation
From the Main Menu make the following selections:
Select Diagnostics
Select Engine or Transmission
The system will then load the appropriate
software
Select Diagnostic Trouble Codes
Connect the PDU to the car as shown on the
screen diagram
Select the / icon to confirm connection
The PDU will then interrogate the chosen control
unit and will display any logged trouble codes.
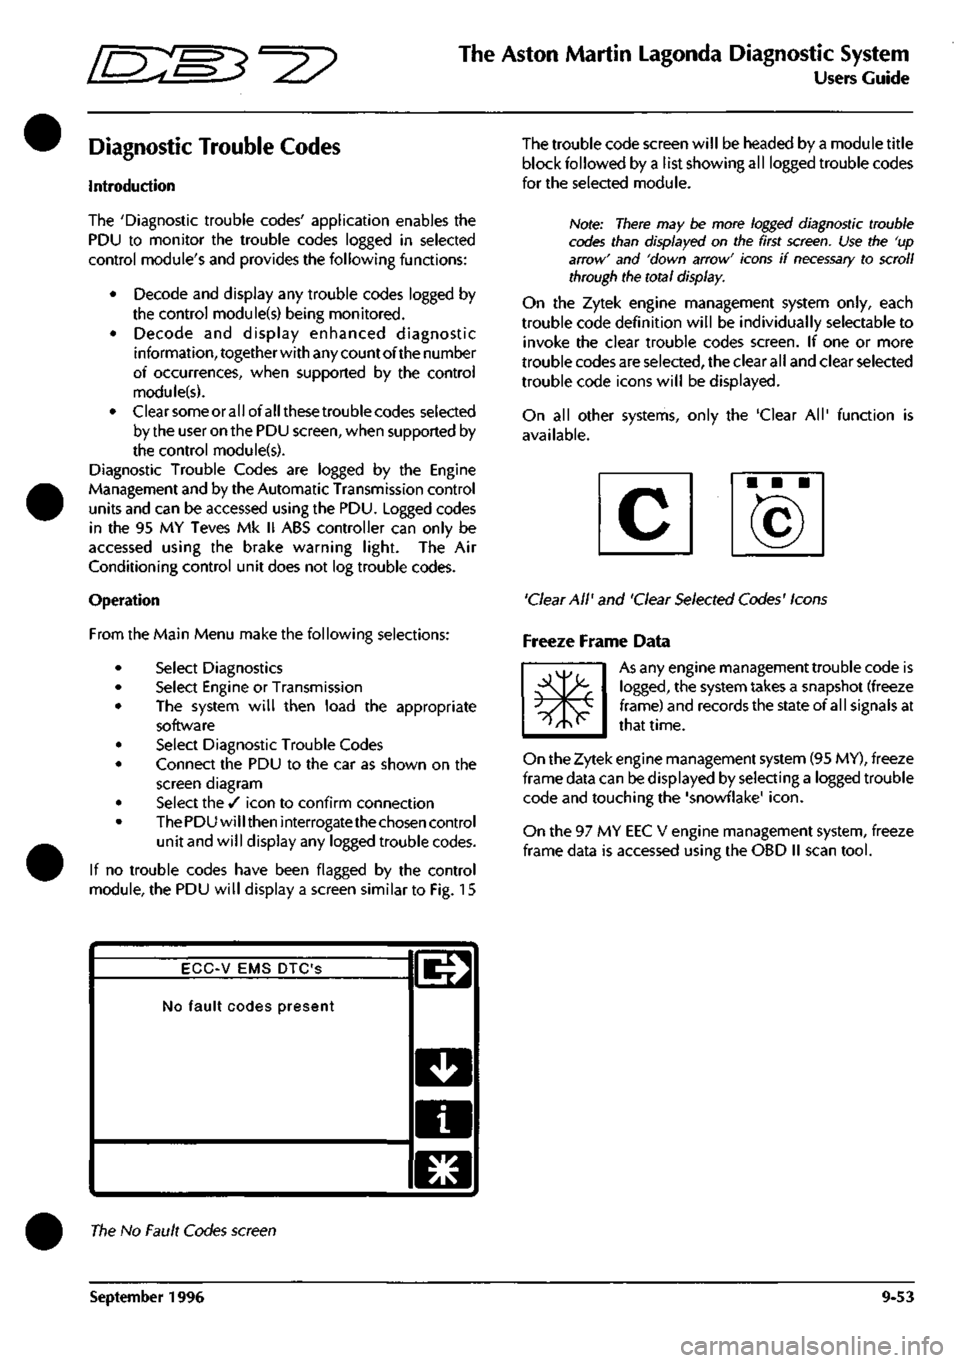
If no trouble codes have been flagged by the control
module, the PDU will display a screen similar to Fig. 15
The trouble code screen will be headed by a module title
block followed by a list showing all logged trouble codes
for the seleaed module.
Note: There may be more logged diagnostic trouble
codes than displayed on the first
screen.
Use the 'up
arrow' and 'down arrow' icons if
necessary
to scroll
through the total display.
On the Zytek engine management system only, each
trouble code definition will be individually selectable to
invoke the clear trouble codes screen. If one or more
trouble codes are selected, the clear all and clear selected
trouble code icons will be displayed.
On all other systems, only the 'Clear All' function is
available.
'Clear All' and 'Clear Selected Codes' Icons
Freeze Frame Data
m*
As any engine management trouble code is
logged,
the system takes a snapshot (freeze
frame) and records the state of all signals at
that time.
On the Zytek engine management system (95 MY), freeze
frame data can be displayed by selecting a logged trouble
code and touching the 'snowflake'
icon.
On the 97 MY EEC V engine management system, freeze
frame data is accessed using the OBD II scan
tool.
ECC-V EMS DTC'S
No fault codes present
l^
D
a
El
The No Fault Codes screen
September 1996 9-53
Page 405 of 421
The Aston Martin Lagonda Diagnostic System
Users Guide
•=2?
Clear all Trouble Codes
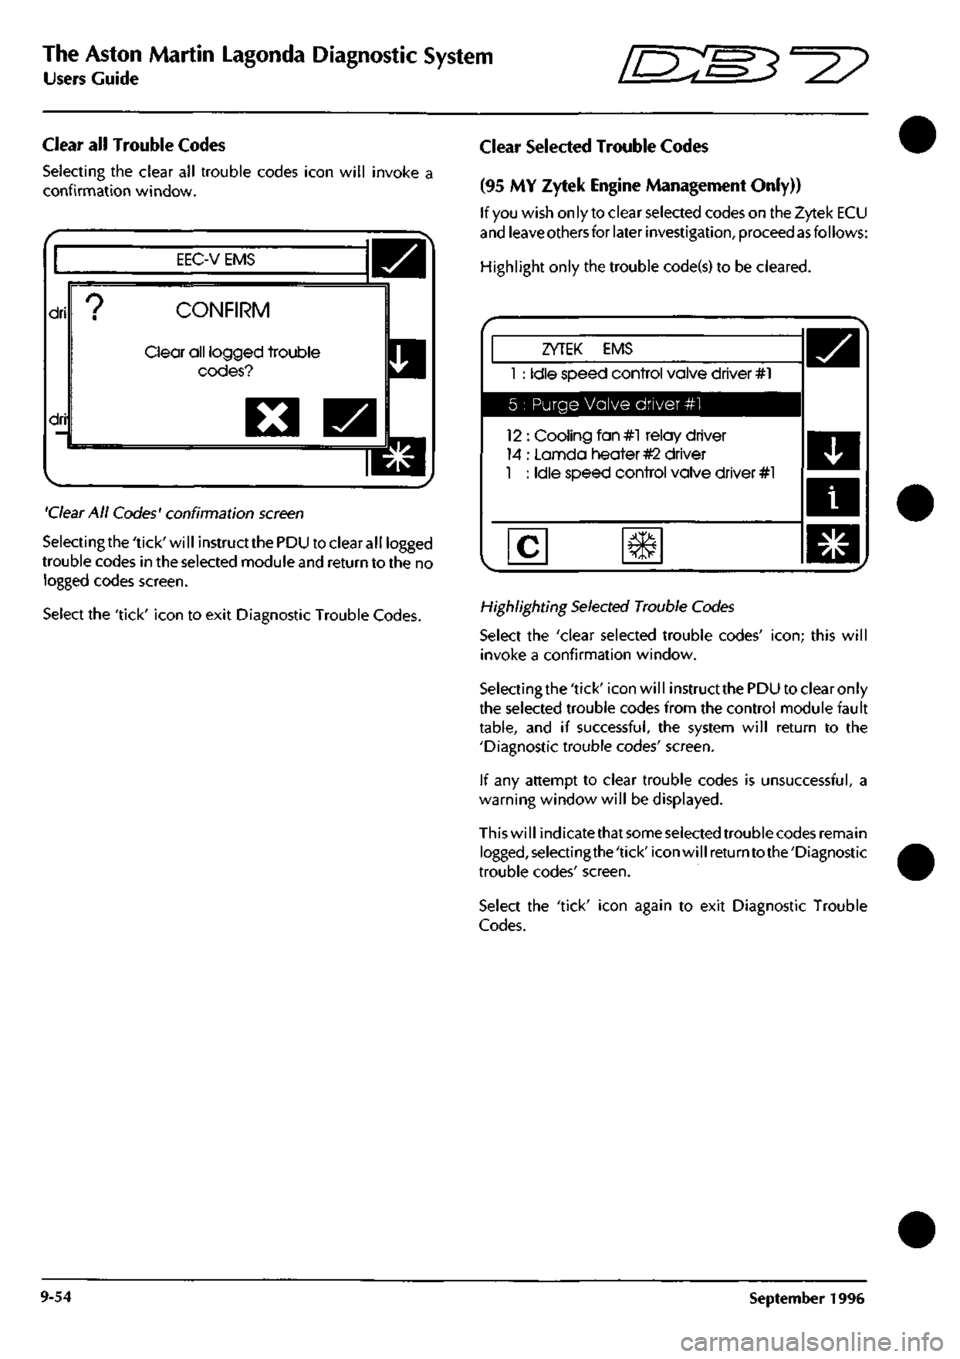
Selecting the clear all trouble codes icon will invoke a
confirmation window.
EEC-V EMS
dri
dri
CONFIRM
Clear all logged trouble
codes?
O
'Clear
All Codes' confirmation
screen
Selectingthe'tick'will instructthePDU to clear all logged
trouble codes in the selected module
and
return to the no
logged codes screen.
Select the 'tick' icon to exit Diagnostic Trouble Codes.
Clear Selected Trouble Codes
(95 MY Zytek Engine Management Only))
If
you
wish only to clear selected codes on the Zytek ECU
and
leave others
for later
investigation,
proceed
as
follows:
Highlight only the trouble code(s) to be cleared.
ZYTEK EMS
1 : Idle speed control valve driver #1
5 : Purge Valve driver #1
12 : Cooling fan#l relay driver
14 : Lannda heater
#2
driver
1 : Idle speed control valve driver #1
Highlighting
Selected
Trouble
Codes
Select the 'clear selected trouble codes'
icon;
this will
invoke a confirmation window.
Selectingthe 'tick' icon will instruct
the
PDU to clear only
the selected trouble codes from the control module fault
table,
and if successful, the system will return to the
'Diagnostic trouble codes' screen.
If any attempt to clear trouble codes is unsuccessful, a
warning window will be displayed.
This will indicatethat
some selected
trouble codes remain
logged,selectingthe'tick'iconwillreturntothe'Diagnostic
trouble codes' screen.
Select the 'tick' icon again to exit Diagnostic Trouble
Codes.
9-54 September 1996
Page 406 of 421
"^I?
The Aston Martin Lagonda Diagnostic System
Users Guide
Datalogger
Introduction
Datalogger is software produced to identify permanent or
intermittent faults on vehicle electronics. The objective of
Datalogger is to provide a view of the vehicle's electrical
behaviour, such that intermittent activity can be recorded
and interpreted quickly and accurately. Running on the
Portable Diagnostic Unit (PDU), the Datalogger
appi ication can captu
re
vehicle information in three ways.
• Serial communications direct from the control unit.
• Parallel communications using the Interface Adaptor.
• Direct signal monitoringusingthemeasurementprobes.
Serial Communication
Serial Communication is a two-wire communication link
between the PDU and most vehicle control modules
providingdigital measurements forconnected components.
The serial communication link allows the tester to
determine the current condition of components connected
to the control module, and to identify any history of faults.
On later vehicles, the PDU is connected to the vehicle
diagnostic sockets via the mu
Iti
Protocol Adaptor (MPA) to
gather serial data from the control modules.
Parallel Communication
The Vehicle Interface Adapter (VIA) provides an interface
between the PDU and the vehicle harnesses for the
acquisition of multiple analogue measurements. The VIA
is
connected between the relevantvehicle control module
and it'sharness connector. Thisallows the PDU to captu re
information from a multitude of channels entering the
control module. This vehicle interface is used with control
modules not equipped with a serial communication link
(Teves Mk II braking system and the air conditioning
system).
Measurement Probes
The measurement probes permit readings to be taken
directly from any connector on the vehicle.
Datalogger Applications
Datalogger may be used to interrogate the following DB7
systems:
• ABS braking system controller
• Engine Management Controller
• Air Conditioning Controller
• Automatic Transmission Controller
• Passive Anti Theft (97 MY)
• Security System (97 MY)
Using the Datalogger
Configure the vehicle to the normal operating conditions
for the system under test.
From the PDU main menu screen:
Highlight 'Diagnostics'.
Press the 'tick' icon to confirm the selection.
Enter the Transmission Type and confirm the selection.
Select the Vehicle Area to be tested and confirm the
selection.
The PDU tools screen should now be displayed.
Highlight 'Datalogger'.
Confirm the selection with the 'tick'
icon.
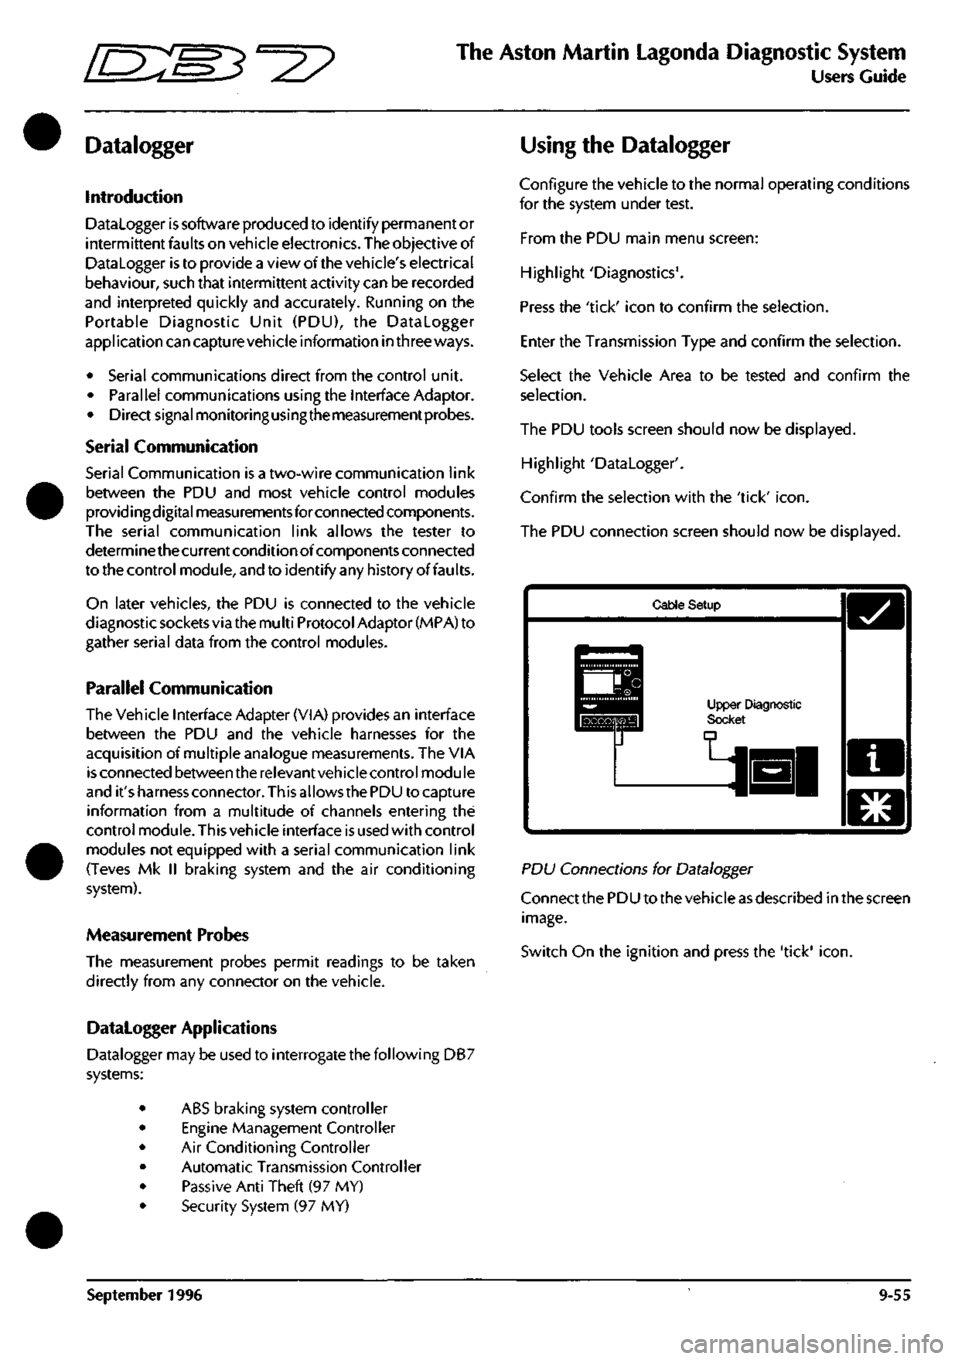
The PDU connection screen should now be displayed.
Cable Setup
Upper Diagnostic Socl
PD\J Connections for Datalogger
Connect the PDU to the vehicle as described in the screen
image.
Switch On the ignition and press the 'tick'
icon.
September 1996 9-55
Page 409 of 421
The Aston Martin Lagonda Diagnostic System
Users Guide 5^^?
Only the data within the selected time period will be
stored.
A trigger is used to define the zero time point on
any waveform display. This is used to make it easier to
locate the actual point at which the fault occurred on the
waveform display. Triggers may take three forms.
1.
Manual Trigger
A manual trigger would be used in circumstances where
the technician can clearly identify the point when the fault
occurs and has access to the PDU at this point.
The trigger icon should be pressed on the waveform /
bargraph display (ortheon-road trigger icon) at the instant
the fault occurs. This will then become the zero point for
the waveform/bargraph display. The waveform/bargraph
display up to this point would have a negative form.
2.
Fault Code Trigger
The fault code trigger is used when the first indication of
a fault is normally by the appearance of a warning lamp
within the instrument pack. For some vehicle systems
Datalogger can trigger on specific fault codes, this type of
triggering is more precise than simply triggering on the
warning lamp.
This trigger
is
selected during the parameter customisation
process. To select a fault code to trigger 'on', set the fault
code (parameter) to record.
Asign the display order by touching the rectangle below
the Eye icon repeatedly until the desired display order
number is shown.
Press the rectangle in the trigger column.
Highlight the fault code parameter again and select the
magnifying glass
icon.
The trigger customisation screen
will be displayed.
Select the appropriate trigger style icon and select the tick
icon to confirm.
Press the Tick icon again to return to the main Datalogger
screen.
Select the Record icon to start data capture.
The unit will trigger when the fault code appears and will
set the zero time point of the waveform / bargraph display.
3. Specific Signal Trigger
It is possible to select a specific parameter or signal to
trigger Datalogger.
Triggering on specific signals is likely to be used when the
vehicle system has no on-board diagnostics or when
diagnostic information is not readily available at the time
the fault occurs, e.g. air-conditioning.
Thistypeoftriggershouldonly be used when it is known
that a particular signal has certain characteristics at the
time the fault occurs, e.g. one signal will always go from
12 Volts to ground, bringing on a warning lamp when a
particular fault occurs,
as
this is a known event, this signal
may be used to trigger the PDU.
Trigger Selection
Any of the record enabled parameters may be used to
trigger Datalogger.
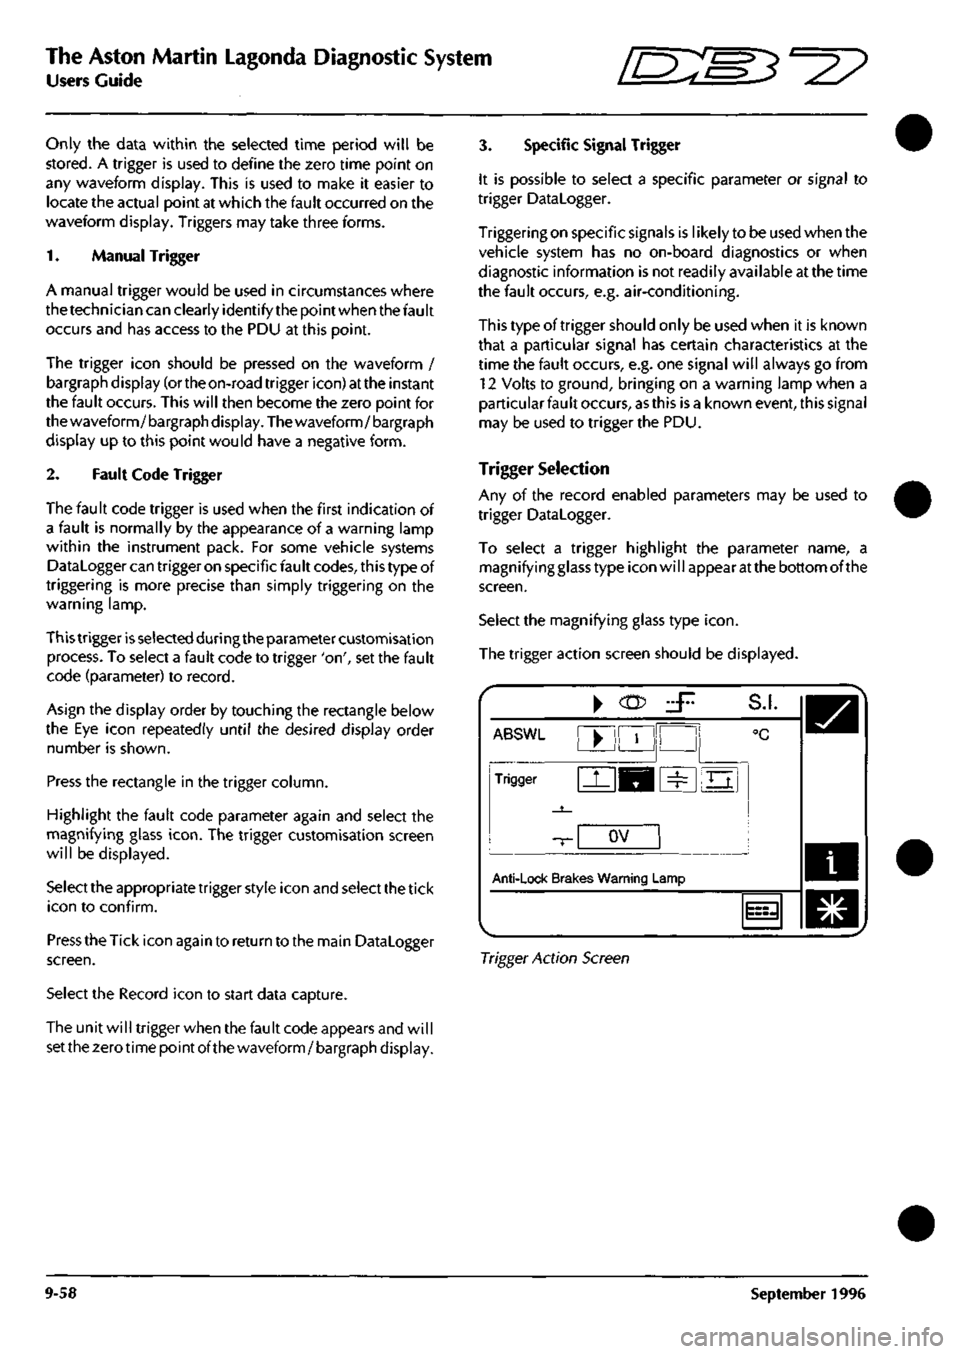
To select a trigger highlight the parameter name, a
magnifying glass type icon will appear at the bottom of the
screen.
Select the magnifying glass type
icon.
The trigger action screen should be displayed.
ABSWl
Trigger
-T-
Anti-lock Brak
^
^M
ov
es Warning
L
zF
!
=^
S.I.
°C
Ei
.amp
i
m,
Trigger Action Screen
9-58 September 1996
Page 410 of 421
^^?
The Aston Martin Lagonda Diagnostic System
Users Guide
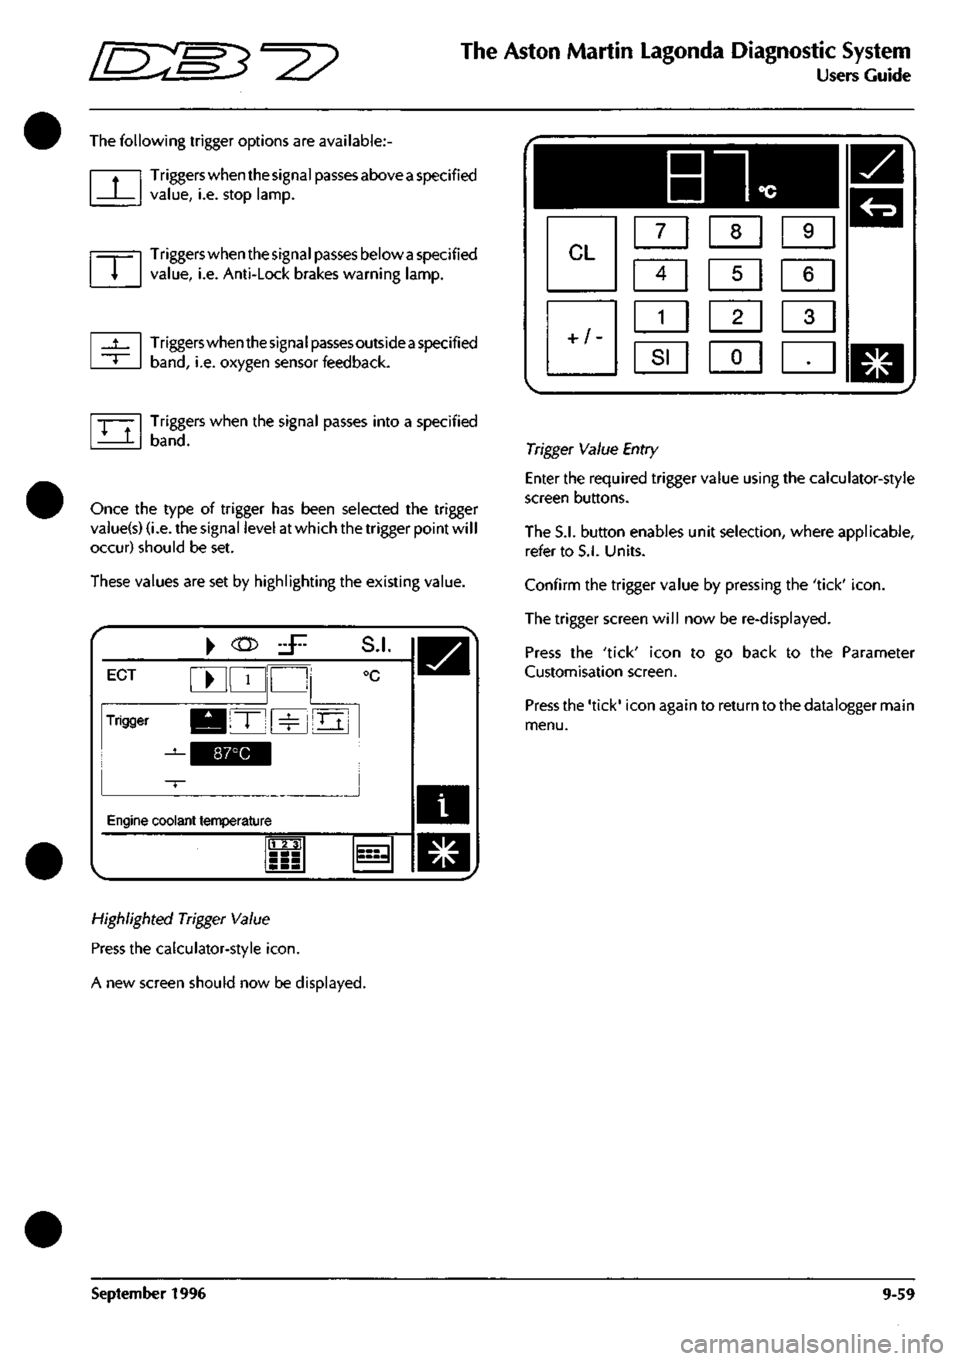
The following trigger options are available:
Triggers when the signal passes above
a
specified
value,
i.e. stop lamp.
Triggers when the signal passes below
a
specified
value,
i.e. Anti-Lock brakes warning lamp.
Triggers when the signa
I
passes outside
a
specified
band,
i.e. oxygen sensor feedback.
Triggers when the signal passes into a specified
band.
Once the type of trigger has been selected the trigger
vaiue(s) (i.e. the signal level at which the trigger point wil
I
occur) should be set.
These values are set by highlighting the existing value.
i
ECT ^ 1
Trigger KBIT" ^
^^^^1
S.I.
°c
Oj
Engine coolant temperature
m
^
Highlighted Trigger Value
Press the calculator-style
icon.
A new screen should now be displayed.
Trigger Value Entry
Enter the required trigger value using the calculator-style
screen buttons.
The S.I. button enables unit selection, where applicable,
refer to S.I. Units.
Confirm the trigger value by pressing the 'tick'
icon.
The trigger screen will now be re-displayed.
Press the 'tick' icon to go back to the Parameter
Customisation screen.
Press the 'tick' icon again to return to the datalogger main
menu.
September 1996 9-59
Page 413 of 421
The Aston Martin Lagonda Diagnostic System
Users Guide ^2?
Split Cursor Icon
The split cursor icon spl its the vertical cursor into
two parts.
1^
VV
One permanent static cursor represented by
a
solid vertical
line in the waveform display, and one moveable cursor
represented by a dotted vertical line, this is moved by
applying finger pressure to the screen in the position the
cursor is required.
The digital display of the waveforms will now represent
the difference in levels between the two cursors and not
the absolute signal level as detailed earlier.
Re-scale Vertical Icon
Normally all of the waveforms are displayed
with the vertical axis representing the maximum
possible variation ofthesignal,
e.g.
battery voltage
0 to 16 V.
The re-scale icon causes the waveform to scale such that
the recorded variation determines the scale, this normally
enlarges the vertical scale.
The scaling operation can be performed on any of the
displayed waveforms by highlighting the parameter name
prior to the operation.
Once auto-scaling
has
taken place, further manual scaling
may be achieved by using the '+' and '-' system icons.
Waveform Display Number
This icon enables control of the number of
waveforms displayed on the screen at any one
MMV
MMV
time.
Pressing this icon causes the '+' and '-' system icons to
appear. Using these system icons increase or decrease the
number of displayed waveforms.
It should be noted that the more waveforms displayed the
poorer the detail becomes, therefore the number of
displayed waveforms should be kept to a minimum.
Horizontal Scale
-^ This icon performs the same function as the re-
scale vertical icon only for the horizontal axis.
By expanding the scale more detail will be available, thus
proving easier to analyse. However the amount of time
displayed on any one screen will be reduced.
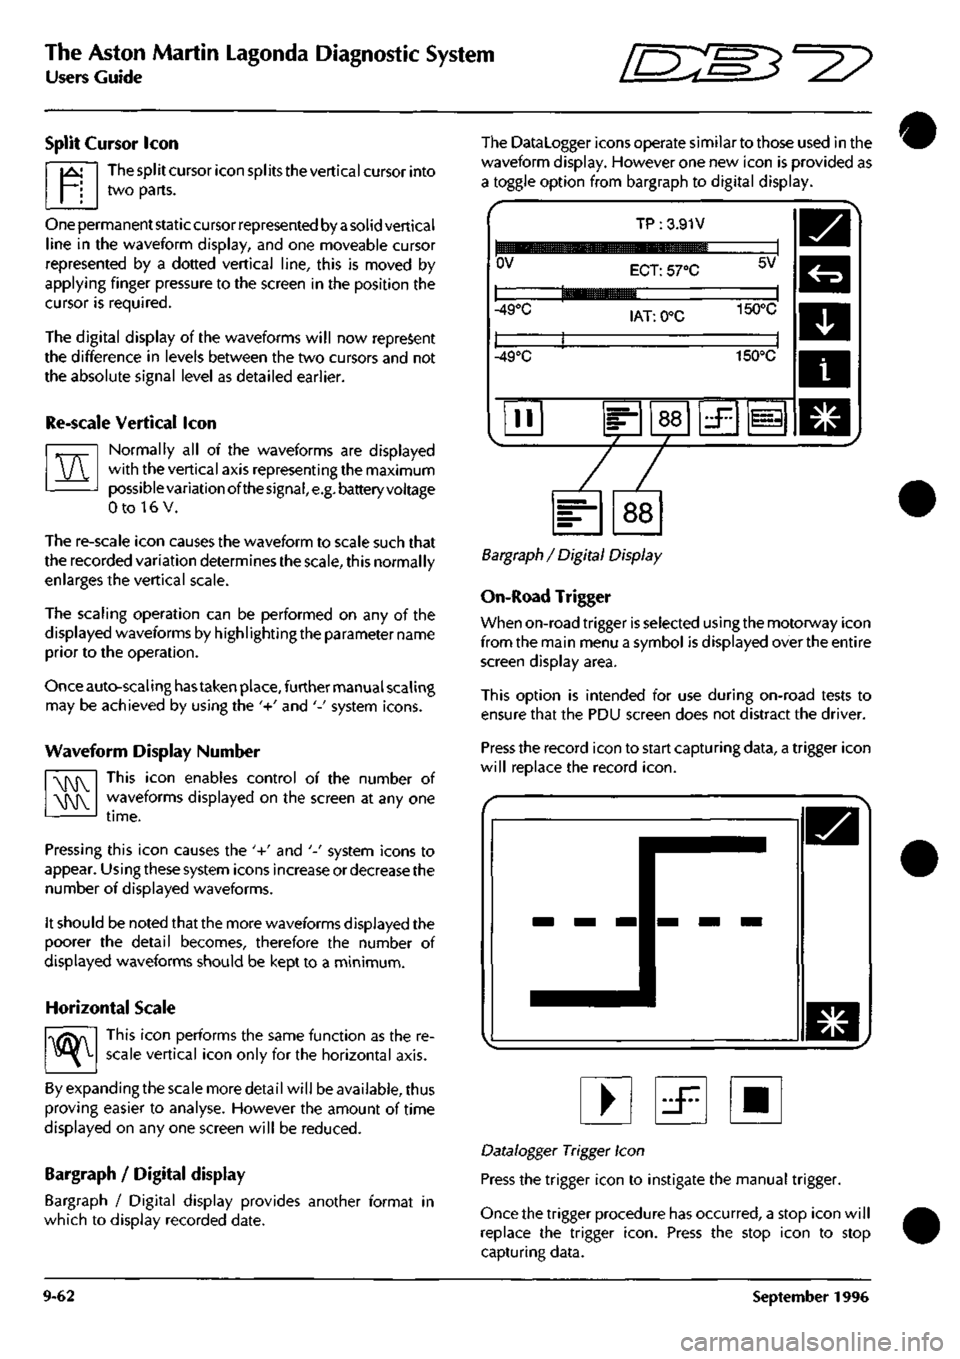
Bargraph / Digital display
Bargraph / Digital display provides another format in
which to display recorded date.
The Datalogger icons operate similar to those used in the
waveform display. However one new icon is provided as
a toggle option from bargraph to digital display.
OV
TP :3.91V
ECT: 57°C 5V
-49°C lAT: 0°C 150°C
-49°C 150°C
II 88 zF 1^
Bargraph / Digital Display
On-Road Trigger
When on-road trigger is selected using the motorway icon
from the main menu a symbol is displayed over the entire
screen display area.
This option is intended for use during on-road tests to
ensure that the PDU screen does not distract the driver.
Press the record icon to start capturing data, a trigger icon
will replace the record
icon.
• iF •
Datalogger Trigger Icon
Press the trigger icon to instigate the manual trigger.
Once the trigger procedure has occurred, a stop icon will
replace the trigger
icon.
Press the stop icon to stop
capturing data.
9-62 September 1996
Page 415 of 421
The Aston Martin Lagonda Diagnostic System
Users Guide
ES^"^?
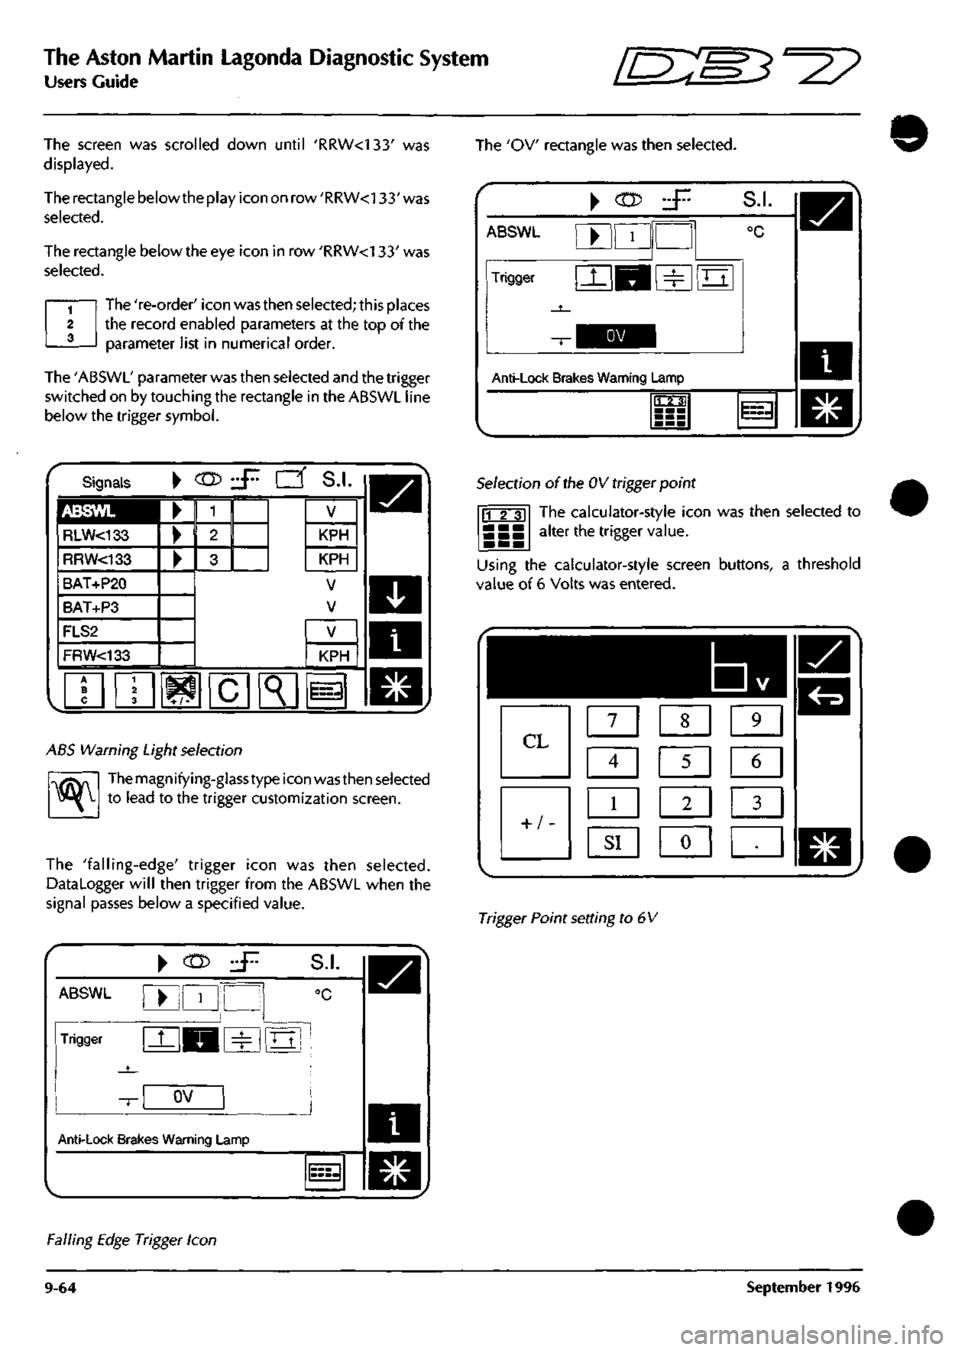
The screen was scrolled down until 'RRW<133' was
displayed.
The rectangle below the play icon on row 'RRW<133' was
selected.
The rectangle below the eye icon in row 'RRW<133' was
selected.
The 're-order' icon was then selected; this places
the record enabled parameters at the top of the
parameter list in numerical order.
The 'ABSWL' parameter was then selected and the trigger
switched on by touching the rectangle in the ABSWL line
below the trigger symbol.
The 'OV rectangle was then selected.
\
(n>
ABSWL
Trigger
S.I.
Anti-Lock Brakes Warning Lamp
1123;
11=3
Signals
ABSWL
RLW<133
RRW<133
BAT+P20
BAT+P3
FLS2
FRW<133
•
KPH
KPH
V
V
^K
KPH
i=
ABS Warning Light selection
^
Themagnifying-glasstype icon wasthen selected
to lead to the trigger customization screen.
The 'falling-edge' trigger icon was then selected.
DataLogger will then trigger from the ABSWL when the
signal passes below a specified value.
Selection of the OV trigger point
The calculator-style icon was then selected to
alter the trigger value. 11 2 31
Using the calculator-style screen buttons, a threshold
value of 6 Volts was entered.
1
7 1 1 8 1 1 9 1
Q
Q
5
1 6 1
LB m
1
^I 1 «J •
Trigger Point setting to 6V
ABSWL
Trigger
Anti-Lock Brak
^
(n>
•
1
'
^H
OV
es Warning L
.jr.
1
S.I.
°C
m
amp
J
l===-l
Falling Edge Trigger Icon
9-64 September 1996
Page 420 of 421

ThesAston Martin LagondanDiagriostic System
Users;
Guide-,^
User Self Test
^ -
The self-test function built into
the
PDU software enables
users
to
completely test the system
for
faulty rnodules and,
cables. By following the screen instructions, faulty system
components
can be
identified.
Procedure
Select User Self-Test from
the PDU
main menu.
The
self-
test software will load from
the CD.
The first screen shows
the
cable setup with
the PDU
connected
to the
base station. After confirming that
the
connections
are
correct,
the
self-test sequence begins.
The initial test
is of
the
PDU and
base station electronics
and takes slightly less than
2
minutes.
The user
is
then directed
to
connect
the
various external
elements of the system
in
turn and confirm the cable setup
at each stage.
As
each element
is
connected
and
tested,
the sequence will either direct that
the
next element
is
connected
or
will report
a
fault
in the
last element tested.
Using this procedure, any faulty element in the system will
be identified.
If the
self-test concludes with
no
fault
reported,
any
problem encountered must be in the vehicle
or
as a
result
of
incorrect
use.
The Asterisk
(*)
lcon?'fi ^^
G * s ^
When available, selecting
the
asterisk icon will bring
up
the
following menu
of
general facilities:
ic
•
•
*
•
• ~',"•'.
•
•
,
•., .,
Resume
Abort . ..
Status
• •
Setup ., , ,
Print Screen
Show trace : T'J
Print trace
D
•u
_ ,1
1
l»
.
*-«•
-
-•
,
'
•
Resume
Return
to the
screen from which
you
selected
the
asterisk
icon.
Abort
•
'•'•'"'
• '• "
'"'^''•'
"'-
' Return
to the PDU
Main Menu.
' ' ' ••'""
Self-Test Problems
If
the
self test software will
not
load
or if
unidentified
problems
are
encountered during
the
self-test,
go to the
problem solving procedure
in
the PDU installation guide.
Be prepared
to
record
any
problem codes which
are
reported during problem solving.
The
Genrad Service
Centre will require
the
problem code number
to
identify
the correct remedial action
and
replacement parts.
Status
Show
the
current software level
and the
application
currently loaded.
--«
^
^.« - ...
•
^f;;fc.i.*ir.
....-^i^cw'i*;*^--'. Print Screen
Send
the
current screen display
to the
printer
.iia*M--i^-Vj^W'JStS:'
.
Show Trace
••'- •
'B-T'^TS
o^
•._,
^,„„, ,' J
rbisplay'the current contents
of
the fracelmemorylDri
^
the screen
(Use the
Down
and
Up^ arrows
to
scroll
•,
through
the
display
if
more than
one
screenful). •
Ai..;:
. ; •
,\J-'!-MT.'
0'; I
Print Trace
•-l.---^,^
• ,\.
^,
,./j-,i:,
Q
:;
Send
the
current contents
of
the trace memory
to the
printer.
I
a-.-s.-™.*'.-jc^.'-v*
September 1996? 9-69,