ESP ASTON MARTIN DB7 1997 Owner's Manual
[x] Cancel search | Manufacturer: ASTON MARTIN, Model Year: 1997, Model line: DB7, Model: ASTON MARTIN DB7 1997Pages: 421, PDF Size: 9.31 MB
Page 400 of 421
^^
The Aston Martin Lagonda Diagnostic System
Users Guide
Print Facility
The print trace and print screen facilities provided on
DB7 CD2 will enable the Dealer to print directly to a
serial printer via an isolated RS 232 cable.
General Information
This cable isdesigned to provide full electrical isolation
between the Portable Diagnostic Unit (PDU) and a
device using the RS232 serial communication port.
The cable is constructed with an in-line module that
contains the optical isolation circuitry, powered from
the PDU.
Printer type
The cable is supplied configured to suite an Epson
LX300 printer. This is the only instal lation verified and
approved by Aston Martin Lagonda Ltd.
Unexpected results may occur if used with an
unapproved printer.
Part Number Equipment type
3539-1114-03 Epson LX300 printer cable kit
comprising
3539-1169-03 Printer Cable
3539-1175-02 User Self Test Adaptor
Connecting to the PDU
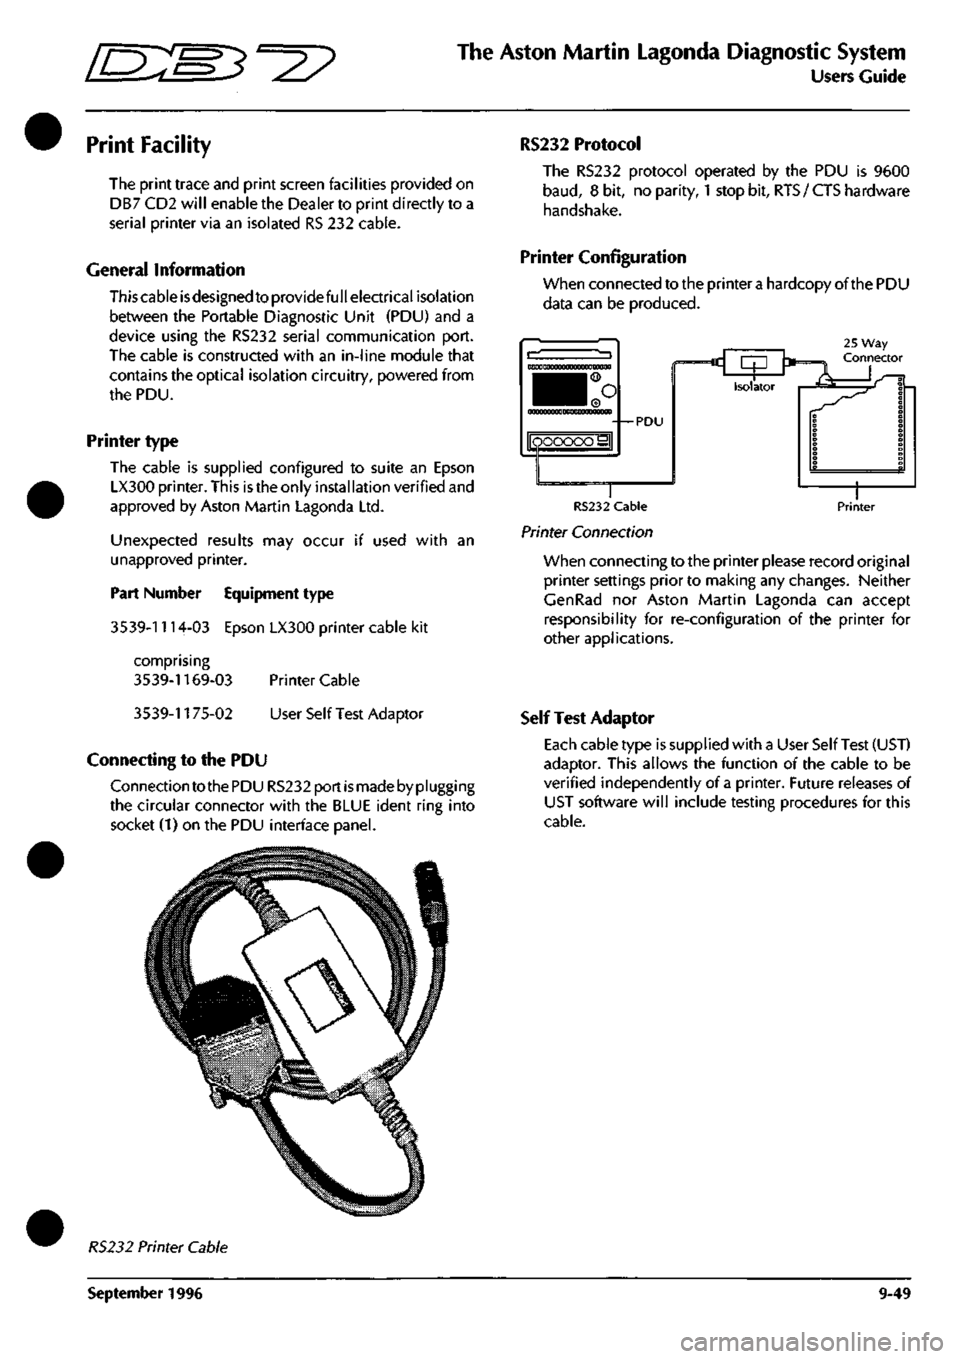
Connection to the PDU RS232 port
is
made by plugging
the circular connector with the BLUE ident ring into
socket (1) on the PDU interface panel.
RS232 Protocol
The RS232 protocol operated by the PDU is 9600
baud,
8 bit, no parity,
1
stop bit,
RTS
/ CTS hardware
handshake.
Printer Configuration
When connected to the printer
a
hardcopy of the PDU
data can be produced.
25 Way Connector c rp '*= Isolator •—*«
RS232 Cable
Printer Connection
Printer
When connecting to the printer please record original
printer settings prior to making any changes. Neither
CenRad nor Aston Martin Lagonda can accept
responsibility for re-configuration of the printer for
other applications.
Self Test Adaptor
Each cable type is supplied with a User Self Test (UST)
adaptor. This allows the function of the cable to be
verified independently of a printer. Future releases of
UST software will include testing procedures for this
cable.
RS232 Printer Cable
September 1996 9-49
Page 403 of 421
The Aston Martin Lagonda Diagnostic System
Users Guide [S:S3^2?
The PDU will then check the cable connections. Until all
connections are correct, the PDU will not allow progression
beyond this
screen.
Pressingthe'asterisk'icon and selecting
abort returns the operator to the general screen if an
incorrect system has been chosen.
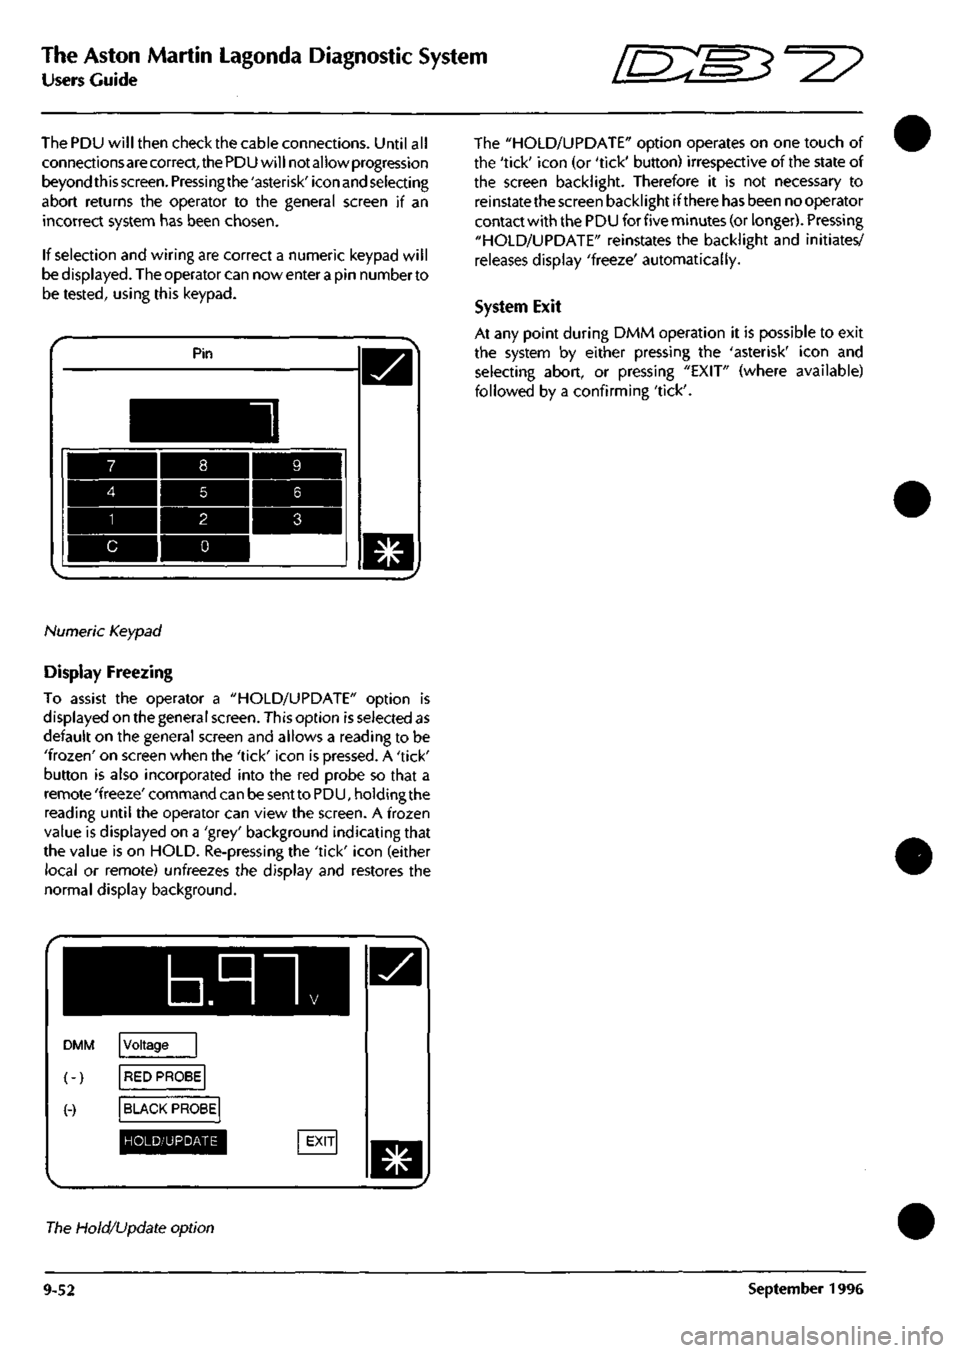
If selection and wiring are correct a numeric keypad will
be displayed. The operator can nowenterapin numberto
be tested, using this keypad.
Pin
Numeric Keypad
Display Freezing
To assist the operator a "HOLD/UPDATE" option is
displayed on the general screen. This option is selected as
default on the general screen and allows a reading to be
'frozen'
on screen when the 'tick' icon is pressed. A 'tick'
button is also incorporated into the red probe so that a
remote 'freeze' command can be sent to PDU, holding the
reading until the operator can view the screen. A frozen
value is displayed on a 'grey' background indicating that
the value is on HOLD. Re-pressing the 'tick' icon (either
local or remote) unfreezes the display and restores the
normal display background.
b.nn
DMM
(-)
(-)
Voltage
RED PROBE
BLACK PROBE
HOLD/UPDATE
The "HOLD/UPDATE" option operates on one touch of
the 'tick' icon (or 'tick' button) irrespective of the state of
the screen backlight. Therefore it is not necessary to
reinstate the screen backlight if there has been no operator
contact with the PDU for five minutes (or longer). Pressing
"HOLD/UPDATE" reinstates the backlight and initiates/
releases display 'freeze' automatically.
System Exit
At any point during DMM operation it is possible to exit
the system by either pressing the 'asterisk' icon and
selecting abort, or pressing "EXIT" (where available)
followed by a confirming 'tick'.
The Hold/Update option
9-52 September 1996
Page 408 of 421
^
The Aston Martin Lagonda Diagnostic System
Users Guide
Parameter Name
Parameters can be fault codes, inputs to, or specific
outputs from, a vehicle control module.
The number of parameters selectable is limited to 32.
If the number of parameters available for customization
exceeds the d isplay
area,
the arrow buttons wi
11
be present,
allowing display area scrolling.
The parameters declared to Datalogger are initially
presented in alphabetical order.
Record Enabled
Record enabled is used to select which signals are to be
recorded.
To select a signal for recording, touch the rectangle next
to the signal name.
The record button will then be displayed.
Nofe:
Additional rectangles may appear in other columns
beside a selected signal name, indicating that the signal
units may be changed or that the signal may be used
as
a
trigger.
It should be noted that the more parameters you select to
record the slower the PDU's sample rate will be for each
parameter e.g. The PDU may be able to monitor six
parameters sampling each parameter twice a second. If
the number of parameters is increased to twelve then the
PDU would only be able to sample each parameter once
per second, thus reducing its ability to capture fast faults;
therefore it
is
recommended that the number of parameters
is kept to a minimum.
Display Order
Parameters may be displayed on the waveform/ bargraph
screen in any order.
To set the parameter display order, press the required
rectangle to create a numbered list.
Note: It
is
not
necessary to
display all of the parameters
required to be recorded.
This has particular benefits if a parameter is to be used as
a trigger but is not required to be displayed.
Trigger Action
For a detailed description of trigger action, refer to the
Trigger Customisation description on the following page.
S.I.
Units
Certain parameters can be measured / displayed in a
number of different units eg temperature in °C or °F. If a
rectangle appears around the displayed units in the
'S.I.'
column then the units are selectable. Each time the
rectangle is pressed, the selectable units scroll one step
through the available options.
Other Features
To make parameter customization easier two icons have
been introduced on to the bottom of the screen, these are:
This icon simply puts all ofthesignals selected for
recording in alphabetical order irrespective of
the language.
A B C
This icon will put all of the signals selected for
recording at the top of the parameter list in
numerical order.
^T/^
After the parameter customization process is completed,
return to the Datalogger main menu.
Default Customisation
To cancel all customisations, press the
Customisation Reset
icon.
This will reset the
customisation on all parameters to the default
setting.
Trigger Customisation
Datalogger operates using a 'rolling memory'.
When the Record icon is selected on the waveform
display, PDU will start to record data, it will then continue
to record data until its memory is
full.
At this point it will continue recording by overriding the
oldest
data.
This process will continue indefinitely or until
the trigger is activated.
When the trigger is activated it performs a number of
functions.
a) The first function istoplaceazerotimepointwithin
the stored data, this enables the trigger point to be
easily accessible in later stages.
b) The second function is to set a timer, ensuring that
the PDU wil
I
only continue recording for the time
selected in 'test-duration'.
September 1996 9-57
Page 411 of 421
The Aston Martin Lagonda Diagnostic System
Users Guide ^?
Datalogger Timing
Select the 'clock' icon from the main menu screen.
Confirm the selection using the 'tick'
icon.
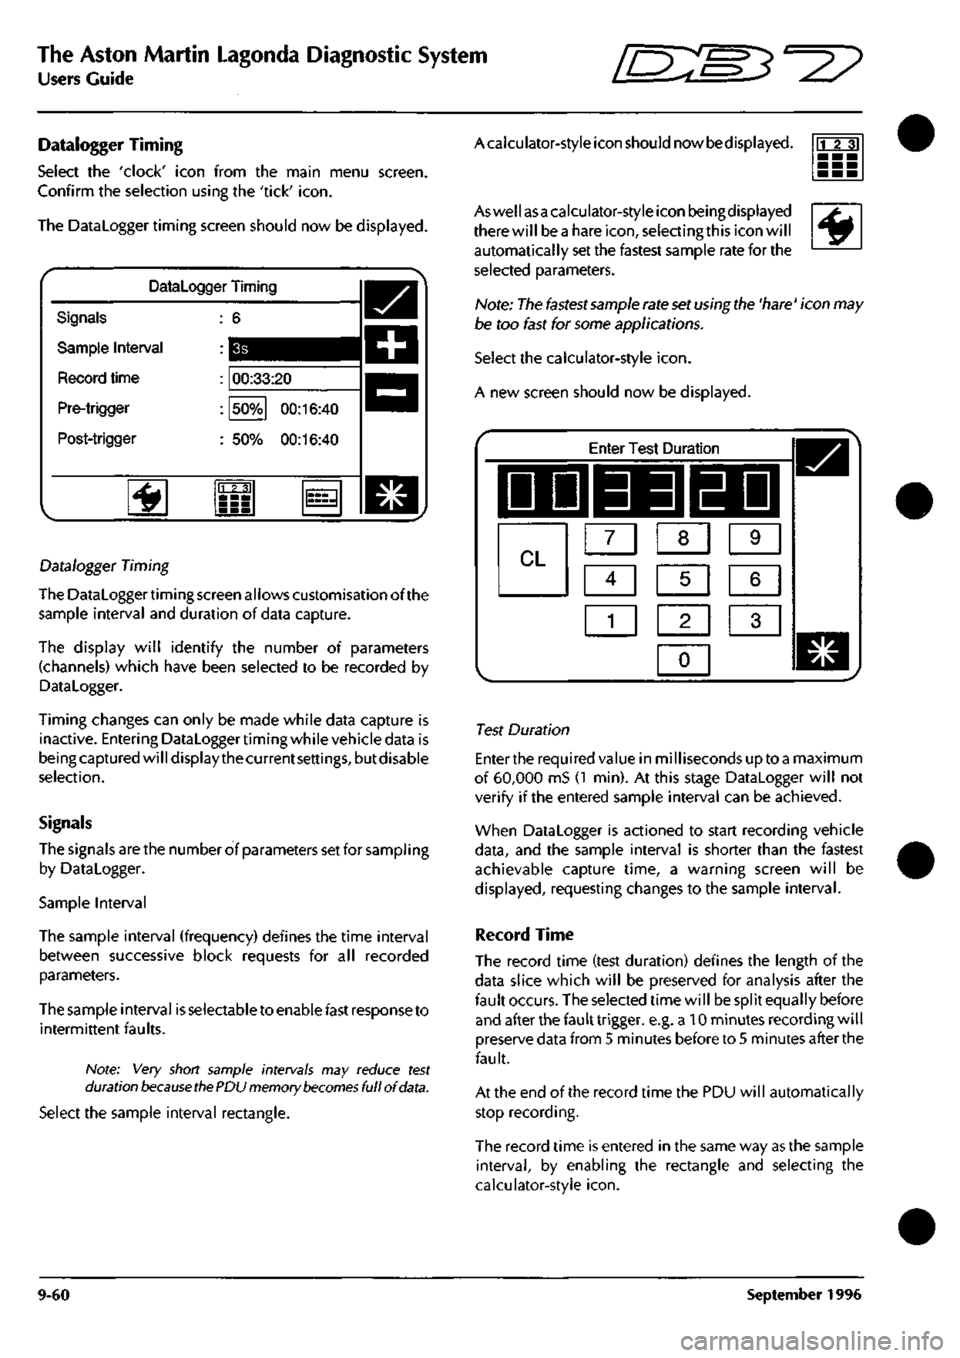
The Datalogger timing screen should now be displayed.
Datalogger Timing
Signals
Sample Interval
Record time
Pre-trigger
Post-trigger
00:33:20
50%
00:16:40
50%
00:16:40
'^
23]
Datalogger Timing
The Datalogger timing screen allows customisation of the
sample interval and duration of data capture.
The display will identify the number of parameters
(channels) which have been selected to be recorded by
Datalogger.
Timing changes can only be made while data capture is
inactive. Entering Dataloggertiming while vehicle data is
being captured will display the current
settings,
but disable
selection.
Signals
The signals are the number of parameters set for sampIing
by Datalogger.
Sample Interval
The sample interval (frequency) defines the time interval
between successive block requests for all recorded
parameters.
The sample interval is selectable to enable fast response to
intermittent faults.
Note: Very short sample intervals may reduce test
duration
because ttie
PDU memory
becomes
full of
data.
Select the sample interval rectangle.
Acaiculator-style icon should nowbedisplayed. rrr?]
^
Aswellasa calculator-style icon beingdisplayed
there will bea hare
icon,
selecting this icon will
automatically set the fastest sample rate for the
selected parameters.
Note: The fastest sannple rate set using the 'hare' icon may
be too fast for some applications.
Select the calculator-style
icon.
A new screen should now be displayed.
Enter Test Duration
IDD 33 EDI
CL m m [Z]
Ci] ra [I]
1
1 2 1 3 1
0
1
Test Duration
Enter the required value in milliseconds up toa maximum
of 60,000 mS (1 min). At this stage Datalogger will not
verify if the entered sample interval can be achieved.
When Datalogger is actioned to start recording vehicle
data,
and the sample interval is shorter than the fastest
achievable capture time, a warning screen will be
displayed,
requesting changes to the sample interval.
Record Time
The record time (test duration) defines the length of the
data slice which will be preserved for analysis after the
fault occurs. The selected time will be split equally before
and after the fault trigger, e.g. a 10 minutes recording will
preserve data from 5 minutes before to 5 minutes after the
fault.
At the end of the record time the PDU will automatically
stop recording.
The record time is entered in the same way as the sample
interval,
by enabling the rectangle and selecting the
calculator-style
icon.
9-60 September 1996
Page 412 of 421
•
^m:E3^^?
The Aston Martin Lagonda Diagnostic System
Users Guide
Pre-trigger and Post-trigger
The pre-trigger and post-trigger represent the duration of
the tests before and after the trigger point respectively.
Waveform
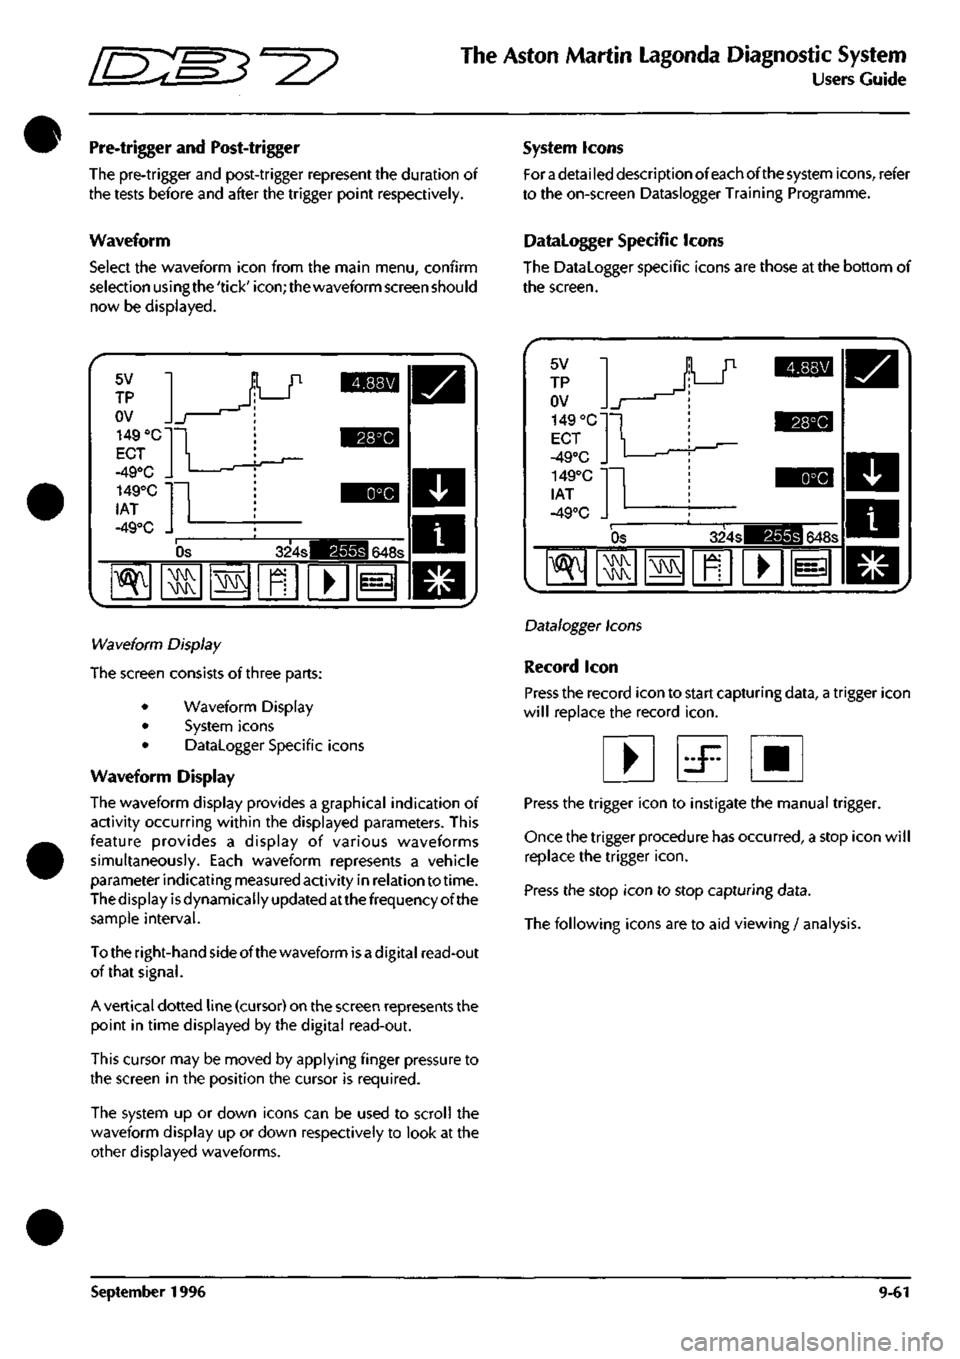
Select the waveform icon from the main menu, confirm
selection usingthe'tick'icon;thewaveform screen should
now be displayed.
System Icons
For
a
detai led description of each of the system icons, refer
to the on-screen Dataslogger Training Programme.
Datalogger Specific Icons
The Datalogger specific icons are those at the bottom of
the screen.
5V
TP
OV
149 "C
ECT
-49°C .
149°C •
lAT
-49°C .
_r
1
^Jh
r
Os 324s 648s
^
\N
• 1=3
Wa\/eiorm Display
The screen consists of three parts:
• Waveform Display
• System icons
• Datalogger Specific icons
Waveform Display
The waveform display provides a graphical indication of
activity occurring within the displayed parameters. This
feature provides a display of various waveforms
simultaneously. Each waveform represents a vehicle
parameterindicatingmeasuredactivity in relation to time.
The display is dynamically updated atthe frequency of the
sample interval.
Totheright-handsideofthewaveform isadigital read-out
of that signal.
A vertical dotted line (cursor) on the screen represents the
point in time displayed by the digital read-out.
This cursor may be moved by applying finger pressure to
the screen in the position the cursor is required.
The system up or down icons can be used to scroll the
waveform display up or down respectively to look at the
other displayed waveforms.
5V
TP
OV
149 °C'
ECT
-49°C ,
149°C
lAT
-49°C . 1
Os 324s 648s
"^
MMV MMV
MMV
1^
•
Datalogger Icons
Record icon
Press the record icon to start capturing data, a trigger icon
will replace the record
icon.
• d^ •
Press the trigger icon to instigate the manual trigger.
Once the trigger procedure has occurred, a stop icon will
replace the trigger
icon.
Press the stop icon to stop capturing data.
The following icons are to aid viewing / analysis.
September 1996 9-61